

Top Software Development Key Performance Indicators to Boost Success

Table of Contents
Software development KPIs are the vital signs of your engineering team. They're measurable values that tell you how effectively your development process is actually working. These metrics go way beyond simple outputs, like how many lines of code were written, and instead help you track what really matters: speed, quality, and business impact.
What Software Development KPIs Actually Measure

Think about a high-performance kitchen in a busy restaurant. You wouldn't judge its success just by the number of plates coming out. You'd look at the quality of the food, how quickly orders are served, and whether the diners are happy. Modern software development key performance indicators (KPIs) operate on the exact same principle, giving you a holistic view of the entire engineering process.
This guide will help you look past outdated vanity metrics to focus on the KPIs that truly define success, from the first spark of an idea all the way to a feature deployed in production.
A Shift From Activity to Outcomes
In the past, many teams got caught up tracking things like lines of code written or the number of commits pushed. The problem is, while these numbers show people are busy, they say almost nothing about the value being created. One developer might write 1,000 lines of clunky, inefficient code, while another solves the same problem with 100 lines of clean, elegant code. Who was more productive?
The right KPIs help you answer the questions that actually matter about your development lifecycle:
- Efficiency: How quickly can we get an idea into the hands of our users as a working feature?
- Reliability: Is the code we're shipping stable, or are we constantly introducing new problems?
- Team Health: Are our developers set up for success, or are they getting bogged down by friction in our process?
- Business Impact: Is the software we’re building actually solving real customer problems and helping the company grow?
Why Tracking the Right Metrics Matters
When you choose the right KPIs, you transform your team from a group that’s just busy into one that’s genuinely effective.
For instance, instead of just counting the number of bugs found, a modern team might track its Change Failure Rate. This metric shows you the percentage of deployments that actually cause a failure in production. It’s a powerful KPI because it directly links development work to the real-world customer experience and system stability.
By focusing on these kinds of outcome-oriented software development KPIs, you get a much clearer picture of what's working and what isn't. This data-driven approach lets you pinpoint bottlenecks, refine your workflows, and tie your engineering efforts directly to business objectives. Ultimately, it ensures every line of code serves a real purpose.
The Four Pillars of Engineering Success
With dozens of software development KPIs to choose from, it's easy to get lost in a sea of data. To cut through the noise, it helps to organize them into a simple framework built on four critical pillars: Speed and Efficiency, Quality and Reliability, Business Impact, and Team Health.
Each pillar represents a core aspect of a high-performing engineering culture. Think of them as the four legs of a table—if one is weak or too short, the whole thing wobbles.
For instance, a team that only chases Speed and Efficiency might ship features lightning-fast, but that often comes at the expense of Quality and Reliability. The result? More bugs, frustrated customers, and a product that feels unstable. It's a classic trap.
On the flip side, an obsessive focus on perfect quality can slow development to a crawl, hurting your Business Impact and your ability to stay competitive. These pillars help you build a balanced measurement strategy that supports real, sustainable growth.
A Framework for Balanced Measurement
A balanced approach helps you avoid the common pitfall of optimizing one area while another suffers—like pushing for speed while your team quietly burns out. The goal is to get a complete picture of your engineering health.
- Speed and Efficiency: This is all about how quickly an idea can go from a whiteboard sketch to a working feature in a customer's hands. It’s a direct measure of your process effectiveness and your ability to eliminate bottlenecks.
- Quality and Reliability: This pillar focuses on how stable, secure, and bug-free your product is. It answers a simple but vital question: "Is the software we're shipping actually dependable?"
- Business Impact: This is where the rubber meets the road. It connects the work your engineering team does directly to company goals, tracking whether the features you build solve real customer problems and drive revenue.
- Team Health: This pillar is about the people behind the code. It keeps a pulse on the well-being and productivity of your developers, helping you spot signs of burnout, process friction, or communication breakdowns.
This visual helps tie it all together, showing how different metrics contribute to a holistic view of performance.
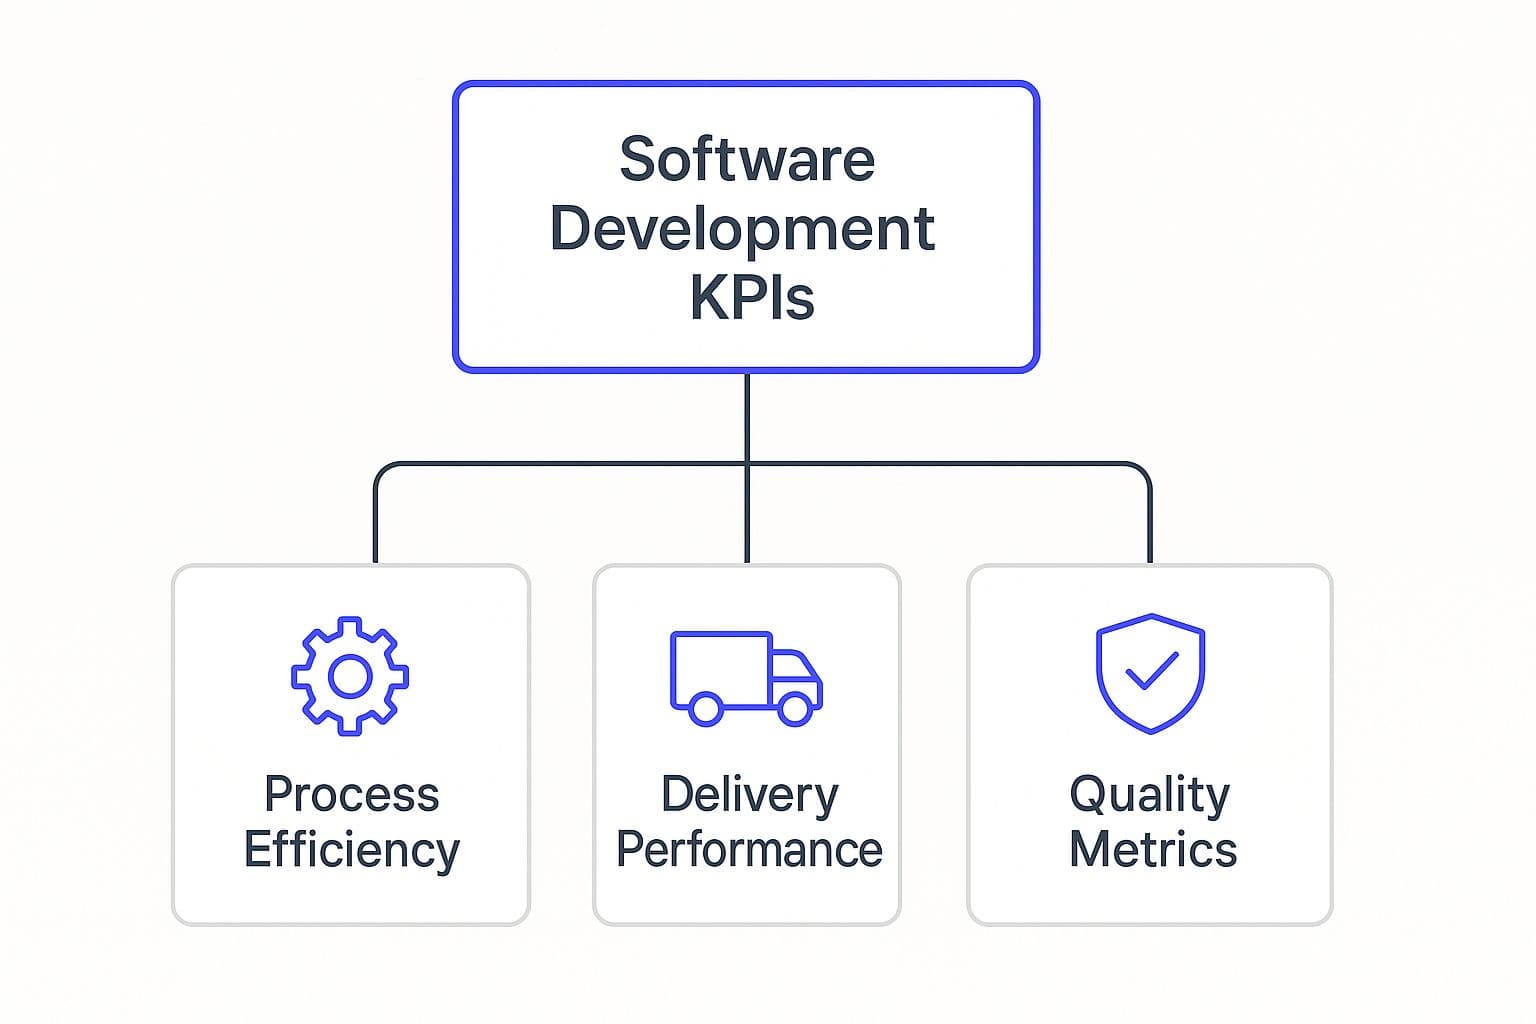
The diagram makes it clear that a smart strategy relies on tracking process efficiency, delivery performance, and quality metrics together, not in isolation.
Adopting this framework helps your team move past vanity metrics and develop a much more mature understanding of what truly drives engineering success. It gives everyone a shared language for talking about performance and aligns day-to-day work with the company's bigger strategic goals, making every sprint more impactful.
Tracking Your Team's Speed and Efficiency
To really get a feel for how quickly your team can turn a great idea into a feature your users can actually use, you have to measure your process. Metrics focused on speed and efficiency aren't about cracking a whip over developers. Not at all. They’re about finding the hidden roadblocks that cause delays, frustration, and wasted effort.
Think of these key performance indicators as a diagnostic tool for the health of your development pipeline. By tracking them, you can pinpoint exactly where work grinds to a halt—whether it's a long queue for code reviews, a clunky testing environment, or a messy handoff between team members. The real goal here is to create a smooth, predictable flow from the first line of code to the final release.
Unpacking Cycle Time
Cycle Time is probably the most crucial metric for understanding your team's pace. It measures the clock from the moment a developer starts actively working on a task—say, their first commit—all the way until that feature is live in production. Shorter cycle times mean you're getting value to your customers faster and in smaller, more manageable chunks.
This KPI is so powerful because it shines a light on every single delay in your system. If your cycle time is dragging, it might point to bottlenecks in code review, QA testing, or the deployment process itself. Fixing these problems doesn't just speed things up; it also boosts team morale by getting rid of the things that make their jobs harder.
Industry benchmarks from 2025 paint a stark picture: elite teams can push code from commit to production in under 26 hours. In contrast, lower-performing teams can take over 167 hours. This isn't just about speed for speed's sake. As it turns out, longer cycle times are strongly correlated with higher change failure rates. Slower pipelines often mean buggier releases. You can dig deeper into how speed impacts stability in recent KPI analyses.
Key Efficiency Metrics to Monitor
While Cycle Time is a fantastic starting point, a few other KPIs help round out the picture of your team's efficiency.
- Lead Time: This is the big-picture metric. It measures the total time from the moment a task is requested (put on the backlog) until it’s delivered to the customer. Lead Time gives you a window into your entire value stream, including the planning and prioritization stages that happen before a developer even starts coding.
- Deployment Frequency: This one’s simple: how often do you successfully ship code to production? Top-tier teams often deploy multiple times a day. A high frequency is a great sign that you have a well-oiled, automated, and reliable release process.
- Work In Progress (WIP): This metric just counts how many tasks are being actively worked on at once. When WIP is too high, it leads to constant context switching and overload, which slows everything down. Keeping this number low is one of the best ways to improve your team's flow.
By keeping a close eye on these essential software development key performance indicators, you can build an engineering organization that’s more responsive, predictable, and ultimately, more effective.
Measuring Your Software Quality and Reliability
Moving fast is great, but not if your product is riddled with bugs. That’s where quality and reliability KPIs come in. Think of them as your engineering team's safety net, making sure that what you ship is solid, dependable, and something your users can count on.
It’s a bit like an airplane maintenance crew. Their job isn’t just to fix things quickly. It’s to ensure every repair makes the plane safer and more reliable for every single flight that follows. The same idea applies to software. These metrics help you shift from constantly putting out fires to building quality into your process from the very beginning.
The True Cost of Poor Quality
Unreliable software doesn't just annoy users; it hits your business where it hurts. Frequent crashes, glitches, and slow performance can torpedo your reputation and send customers running to your competitors. In fact, studies show that 73% of users will ditch a product after just a couple of bad experiences.
On top of that, a constant stream of bugs creates a ton of "unplanned work," pulling developers away from building the cool new features on your roadmap. This puts the brakes on innovation. To get the full picture, it’s worth understanding all the factors that contribute to software development costs in our detailed guide.
Key Metrics for Software Stability
To get a real, data-backed view of your product's health, you need to track specific software quality metrics. They give you direct feedback on how well your QA process is working and how stable your code is in the wild.
Here are a few of the most critical ones to watch:
- Change Failure Rate (CFR): This tells you what percentage of your deployments to production end up causing a failure that needs a hotfix or a rollback. A low CFR is a huge vote of confidence in your testing and deployment pipeline. Top-tier teams often keep their CFR below 15%.
- Mean Time to Recovery (MTTR): When things do go wrong—and they always do—how fast can your team get the service back up and running? MTTR measures the average time it takes to recover from a production failure. A low MTTR shows your team is resilient and can solve big problems without skipping a beat.
- Escaped Defects: This is exactly what it sounds like: the number of bugs that slip through your QA process and are found by actual users. A high number of escaped defects is a red flag, pointing to potential gaps in your testing strategy or a need for more automated tests. Keeping an eye on this helps you plug those holes before code ever gets to the customer.
Understanding Developer Productivity and Team Health

A productive engineering team isn’t just about shipping code at lightning speed. It's about building a team that is healthy, engaged, and truly empowered to do great work. The best software development KPIs today have shifted to measure the human side of engineering, acknowledging that a developer's well-being is directly tied to innovation and quality output.
Forget misleading metrics like the number of commits. Modern frameworks help you see what’s really driving productivity. This means looking past raw activity to find out if developers are actually being effective or just drowning in endless meetings, constant context switching, and frustrating roadblocks. A burned-out team is never a productive team.
Ultimately, this approach gives you a more balanced view. It's about creating a supportive environment where developers can focus on what they do best—solving problems and writing code. It’s less about measuring output and more about removing obstacles.
The SPACE Framework: A Holistic View
To get this broader perspective, many leading organizations turn to frameworks that blend hard data with qualitative feedback. One of the most powerful tools for this is the SPACE framework, which evaluates productivity across five crucial dimensions. It gives you a structured way to measure what once felt intangible.
This model, developed by Microsoft and GitHub, moves way beyond simple output counts. It assesses five key areas: Satisfaction and well-being, Performance, Activity, Communication and collaboration, and Efficiency and flow. For example, measuring Developer Satisfaction tells you how developers feel about their work and tools, while Activity metrics track concrete outputs like commits or completed story points.
Understanding these different dimensions helps you paint a complete and accurate picture of your team's health.
Measuring What Truly Matters
So, how do you put this into practice? It starts with simple, consistent measurement that centers on the developer experience.
- Developer Satisfaction: Run short, regular surveys to get a pulse on how your team is feeling. Ask about their tools, workflow, and any friction points. Are they happy with the code review process? Do they feel their work is making an impact?
- Focus Time vs. Interruptions: Start tracking how much uninterrupted time developers get each day. Constant context switching is a notorious productivity killer. If your team spends more time in meetings than they do in their code editor, you've found a major problem.
- Flow Efficiency: This metric measures the percentage of time a task is actively being worked on versus just sitting in a queue. Low flow efficiency is a massive red flag for systemic bottlenecks that are slowing everyone down and causing frustration.
A healthy, happy team is your most valuable asset. By tracking these human-centric KPIs, you can build a more resilient and innovative engineering culture. Knowing how to hire software developers is just the starting line; creating an environment where they can actually thrive is what wins the race.
Putting Your KPI Strategy Into Action
Knowing which software development KPIs to track is just the starting point. The real challenge—and where the value lies—is building a measurement strategy your team can actually get behind without it feeling like Big Brother is watching. A successful rollout is all about good communication and a shared focus on getting better.
Start small. Seriously. Don't overwhelm your team by dropping a dozen new dashboards on them at once. Pick just two or three key metrics that directly address a current team priority. For instance, if your main goal is to stop bugs from slipping through to production, you might begin by tracking Change Failure Rate and Escaped Defects.
Building Team Buy-In
How you introduce these KPIs makes all the difference. Frame them as tools for finding and fixing friction in your process, not as a way to grade individual performance. The conversation should always circle back to improving the system, not pointing fingers. This transforms measurement from a top-down mandate into a collaborative mission to make everyone's work life better.
Setting Up for Success
Once your team is on board, you can get down to the nuts and bolts of implementation. This means picking the right tools for the job, setting goals that are actually achievable, and establishing a consistent rhythm for reviewing the data.
Here’s a simple path to get you started:
- Automate Data Collection: Manually pulling metrics is a surefire way to make the whole initiative fail. Use tools that plug directly into your existing workflow—think Jira or GitHub—to gather data automatically. This ensures your numbers are always accurate and up-to-date without creating extra work.
- Establish Realistic Benchmarks: Don't compare your team's day-one performance to industry superstars. Look at your own historical data to set an initial baseline. The goal isn't perfection overnight; it's about making small, steady gains over time.
- Create a Review Rhythm: Put a recurring, low-pressure meeting on the calendar to look at the KPI trends together. These check-ins should be about shared learning and brainstorming solutions, not delivering status reports.
For a more in-depth roadmap, take a look at our guide on creating an effective implementation plan for software, which can help you structure this entire process.
Common Questions We Hear About Software KPIs
Diving into the world of software development KPIs can feel a bit daunting. A lot of questions tend to pop up, and getting clear answers is the first step to building a measurement strategy that actually helps your team, rather than just burying them in charts.
Let's clear the air and tackle some of the most common questions I hear from engineering leaders. The goal here is to give you some quick, practical advice you can put to work immediately.
What Are The Best KPIs To Start With?
If you're just getting your feet wet, don't try to measure everything at once. You'll just create noise. The best place to start is with the four core DORA metrics. They’ve become the industry standard for a good reason—they provide a balanced, high-level view of your team's performance without overwhelming you.
These four give you a solid picture of both your team's velocity and its stability:
- Deployment Frequency: How often are you actually shipping code to users?
- Lead Time for Changes: Once a change is committed, how long does it take to get it live?
- Change Failure Rate: What percentage of your deployments blow up in production?
- Time to Restore Service: When things do break, how fast can you fix them?
How Do We Track KPIs Without It Feeling Like Big Brother Is Watching?
This is a huge one, and it all comes down to trust and framing. You have to make it crystal clear that these metrics are about improving the system, not judging the people within it. When developers understand that the goal is to spot and fix bottlenecks, they'll get on board.
Always focus on team-level metrics, not individual scorecards. Even better, get the whole team involved in picking the KPIs and analyzing the trends together. When the data shows that code reviews are taking forever, it's no longer a finger-pointing exercise. It’s a shared problem the team can solve to make their own lives easier.
Is Lines Of Code A Good KPI?
In a word: no. Lines of Code (LOC) is probably the most famous vanity metric in software development. It's not just useless; it can be actively harmful because it encourages completely the wrong behaviors.
Think about it: one developer might solve a complex problem with 50 lines of clean, brilliant code. Another might write 500 lines of clunky, inefficient code to accomplish the same thing. Who would you rather have?
Focusing on LOC incentivizes quantity over quality. It tells you nothing about the value, the efficiency, or the maintainability of the work. Stick with metrics that measure real-world impact, like Cycle Time or Change Failure Rate, which tell you a story about the value your team is actually delivering.
Ready to turn your idea into a market-ready product without the guesswork? Iglu Digital specializes in building high-quality MVPs with the scope and the price agreed before we start. We combine speed, strategy, and user-focused design to launch your vision fast. Start building with us today.