

Key Performance Indicators Software Development | Boost Your Team
Table of Contents
In software development, key performance indicators (or KPIs) are simply the numbers that tell you how your team is really doing. They're the specific, quantifiable metrics you can track to get a clear, honest picture of your team's efficiency, the quality of your work, and the overall health of your engineering culture.
These metrics provide crucial, data-driven feedback that helps development teams understand performance, pinpoint bottlenecks, and ultimately, deliver better products faster. Without them, you're just guessing.
Why Software Development KPIs Are Your Team's Dashboard
Think about it this way: could you drive a high-performance car without a dashboard? You'd have no idea how fast you were going, how much fuel you had left, or if the engine was about to overheat. You're moving, sure, but you have no real information to guide you. That’s exactly what it feels like to run a software team without KPIs—you’re flying blind.
Key performance indicators in software development are that essential dashboard. They aren't there for micromanaging people or creating leaderboards to pit developers against each other. The real goal is to empower the entire team with objective insights. They turn vague goals like "we need to be more efficient" or "let's improve quality" into concrete, measurable data points we can all rally around.
This focus on data naturally builds a culture of continuous improvement. For instance, if a team notices its Cycle Time is creeping up, it’s not a mark of failure. Instead, it’s a signal—a flashing light on the dashboard—telling them to pop the hood and investigate the process. Are code reviews getting stuck? Is the testing pipeline causing delays? KPIs show you the what, so your team can dig in and find the why.
The Power of Data-Driven Decisions
When you track the right metrics, you and your team can stop relying on gut feelings and start making decisions based on evidence. This clarity is a game-changer for several reasons:
- Identifying Bottlenecks: You can finally see the hidden friction points in your development lifecycle that are slowing everyone down.
- Predicting Delivery: It becomes much easier to give a reliable answer to the question, "When will this be done?"
- Enhancing Quality: You can spot trends in bug rates or system failures long before they become a major headache for your users.
- Improving Team Health: Metrics can even be an early warning system for things like burnout or process frustration.
This infographic breaks down how core KPIs relate to different parts of the development process.
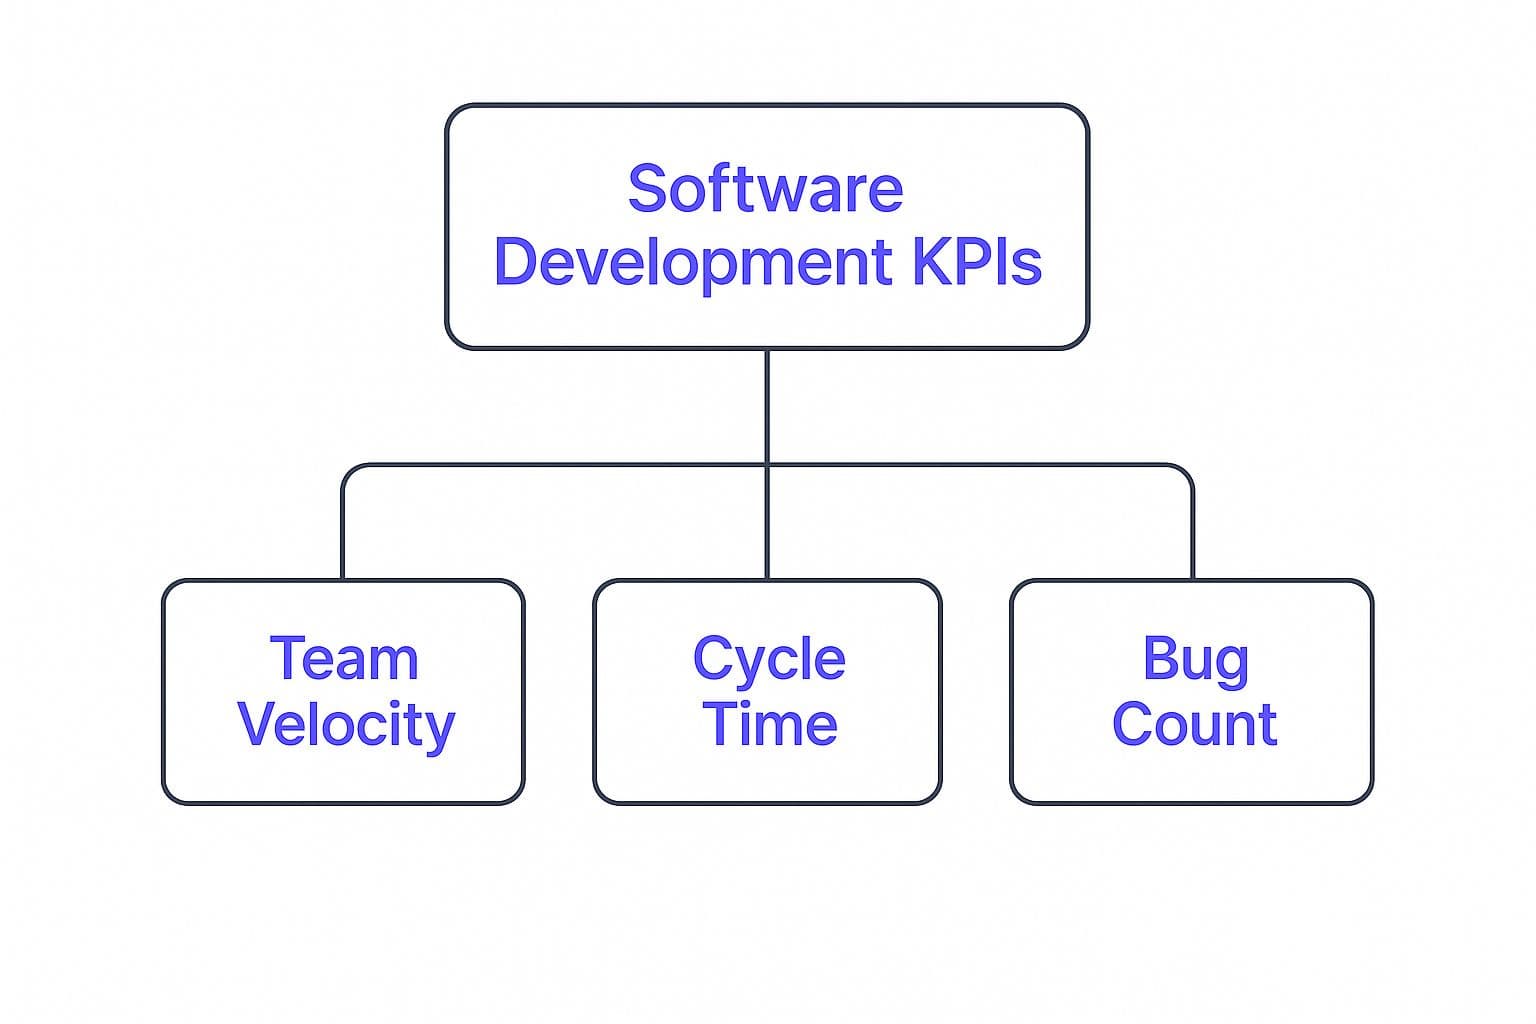
As the diagram shows, you can group these metrics into foundational pillars like speed, process efficiency, and quality—all connecting to the central goal of building great software.
To make this even clearer, let's group these metrics into a few logical categories. Getting a handle on these categories is the first step toward building a balanced and truly effective measurement program for your team.
Core Software Development KPI Categories
Here’s a quick summary of the main categories of software development KPIs, what they’re for, and some key examples in each.
| KPI Category | Primary Purpose | Example Metrics |
|---|---|---|
| Speed & Throughput | To measure the velocity and efficiency of the development process. | Cycle Time, Deployment Frequency |
| Quality & Stability | To assess the reliability of the software and the development process. | Change Failure Rate, Bug Rate |
| Team & Process Health | To evaluate team satisfaction and collaboration effectiveness. | Team Morale, Code Review Velocity |
These categories are the building blocks for a holistic view of your engineering performance. By pulling metrics from each one, you get a comprehensive picture of not just what your team is building, but just as importantly, how they're building it.
5. Measuring Your Team's Speed and Throughput

When we talk about software development performance, the conversation almost always starts with speed. How fast can your team actually deliver value to users? The metrics that measure your team's speed and throughput tell the real story of your development engine's horsepower.
These aren't just vanity metrics. They go way beyond simple output to show you how efficient and predictable your entire workflow really is. Think of your development process like a manufacturing plant. You don't just want workers moving fast; you want a finished, high-quality product rolling off the line smoothly and on a consistent schedule.
This is where a couple of key metrics from the DORA (DevOps Research and Assessment) framework come into play: Cycle Time and Deployment Frequency. They aren't just numbers on a dashboard; they tell a narrative. A long Cycle Time, for example, is a story about a bottleneck hiding somewhere in your system. It could be a tale of code reviews sitting idle for days, a staging environment that’s constantly on fire, or a deployment process that’s painfully manual and risky.
Decoding Cycle Time
Cycle Time is the full journey a piece of work takes from the moment a developer writes the first line of code (the first commit) all the way until that code is live and running in production. It’s the ultimate measure of how long it takes to turn a concept into a tangible feature for your customers. A short cycle time is a massive signal of a healthy, efficient development process.
On the flip side, a long or unpredictable cycle time points directly to friction in your process. Cycle Time is one of the most critical KPIs you can track. According to industry benchmarks from LinearB, elite software development teams get code to production in under 26 hours. In stark contrast, teams that are struggling take over 167 hours on average to complete the same journey. That huge gap shows just how much Cycle Time impacts not only speed but also quality and team morale.
Tracking this KPI forces you to ask the right questions:
- Where is work getting stuck? Is it sitting in a "waiting for review" column? Is QA the bottleneck? Or is deployment itself the issue?
- Are our tasks too big? Breaking down massive features into smaller, more manageable chunks is a surefire way to shorten cycle times.
- Is our process just too complicated? Every single handoff and approval step adds time and potential for delay.
Understanding Deployment Frequency
While Cycle Time tracks the speed of a single change, Deployment Frequency measures how often your team pushes new code to production. Are you deploying multiple times a day, once a week, or holding your breath for a "big bang" release once a month? Elite teams deploy on-demand, often several times per day.
This KPI is a direct reflection of your team's agility and the maturity of your automation. A high deployment frequency is almost always the result of a solid CI/CD (Continuous Integration/Continuous Deployment) pipeline, great test coverage, and a culture that isn't afraid of small, frequent releases. It’s a sign of confidence.
If your deployment frequency is low, it's another powerful diagnostic tool. It might be telling you:
- The team is afraid of breaking things. This usually points to a need for better automated tests or solid rollback strategies.
- Deployments are a manual, high-effort nightmare. This is a clear signal that you need to invest in your deployment automation.
- Changes are being batched. Teams might be bundling tons of features into one massive, high-risk release instead of deploying them as they're ready.
Getting better at these two metrics has a direct impact on your project outcomes. By focusing on your throughput, you get a much clearer picture for estimating software development time on future projects. At the end of the day, measuring speed isn't about cracking the whip to make developers work faster; it’s about finding and removing the obstacles that are slowing them down, creating a smoother path from a developer's keyboard to your customer.
5. Ensuring Quality and System Stability
It’s easy to get obsessed with speed in software development. But shipping code fast is a hollow victory if the system constantly breaks. It's like building a race car that sets a blistering lap time right before the engine explodes. That's why quality and stability metrics are your most critical gauges on the dashboard.
These aren't just vanity numbers; they tell you how durable and reliable your software really is. They force a shift in thinking from "How fast can we ship?" to "How well are we building this?" Getting these right is fundamental to earning user trust and saving your developers from the burnout that comes with constant firefighting.
Change Failure Rate (CFR)
Of all the quality metrics, the Change Failure Rate (CFR) is one of the most revealing. Simply put, it measures what percentage of your deployments to production cause a failure. This could be anything from a full-blown outage to a critical bug that requires an immediate hotfix or rollback.
Think of it this way: if a factory's assembly line produced a high number of faulty products, you wouldn't just tell the workers to move faster. You'd halt production to find the root cause. A high CFR is the same red flag for your software delivery pipeline.
To bring this number down, you need to build a better safety net. The most effective strategies usually involve:
- Solid Automated Testing: Create a comprehensive suite of unit, integration, and end-to-end tests that must pass before any code gets deployed.
- A Strong Code Review Culture: Treat code reviews as a vital, non-negotiable step where feedback is thorough, constructive, and prioritized.
- Mirrored Staging Environments: Use a pre-production environment that is an exact replica of your live system. It's the ultimate place to catch issues before they ever see a real user.
Mean Time to Recovery (MTTR)
Failures are inevitable. Even the best teams run into problems. So, when something does go wrong, the most important question becomes: how fast can we fix it? That's precisely what Mean Time to Recovery (MTTR) measures. It tracks the average time from when a production failure is first detected to when service is fully restored for users.
A low MTTR is the hallmark of a truly resilient system and a well-prepared team. It demonstrates that you have the right monitoring, alerting, and operational know-how to pounce on incidents and resolve them effectively. On the flip side, a high MTTR means that when things break, they stay broken for a dangerously long time, causing maximum damage.
To improve your MTTR, you have to sharpen your incident response. This means having clear on-call schedules, well-documented playbooks for common failures, and tools that make rollbacks or fixes nearly instantaneous. Some teams even practice chaos engineering—purposefully injecting small, controlled failures into their systems to see how they respond. It's the ultimate fire drill for your team and your tech.
Bug Rate
Beyond just deployment failures, you have to keep an eye on the overall quality of your code. Bug Rate is a fundamental KPI that does just that. It tracks the number of defects found both during development and after the software has been released. A rising bug rate is a clear sign that quality is slipping.
This metric serves as a direct proxy for the user experience. Keeping the bug count low is essential for keeping users happy and preventing developers from spending all their time on fixes instead of features. As you might expect, teams that are diligent about tracking and squashing bugs consistently deliver better products and have much lower rework costs. You can find more details about software development KPIs on kodus.io.
Ultimately, these stability metrics are all connected. A low Change Failure Rate, a quick MTTR, and a minimal Bug Rate are the signs of a team that has mastered the balance between speed and craftsmanship. They don't just launch products quickly—they build them to last.
Building Your KPI Measurement Program
Knowing what software development KPIs are is one thing, but actually putting them to work is a whole different ballgame. Moving from theory to practice isn’t about just grabbing a few metrics off a list. It's about carefully building a program your team actually buys into—one they use to get better every single day.
Think of it like setting up a new home gym. You don't just buy every piece of equipment you see. You figure out your fitness goals first, pick a few key machines to start, and then build from there. A cluttered, chaotic approach just leads to dusty equipment, but a smart, focused plan gets you real results.
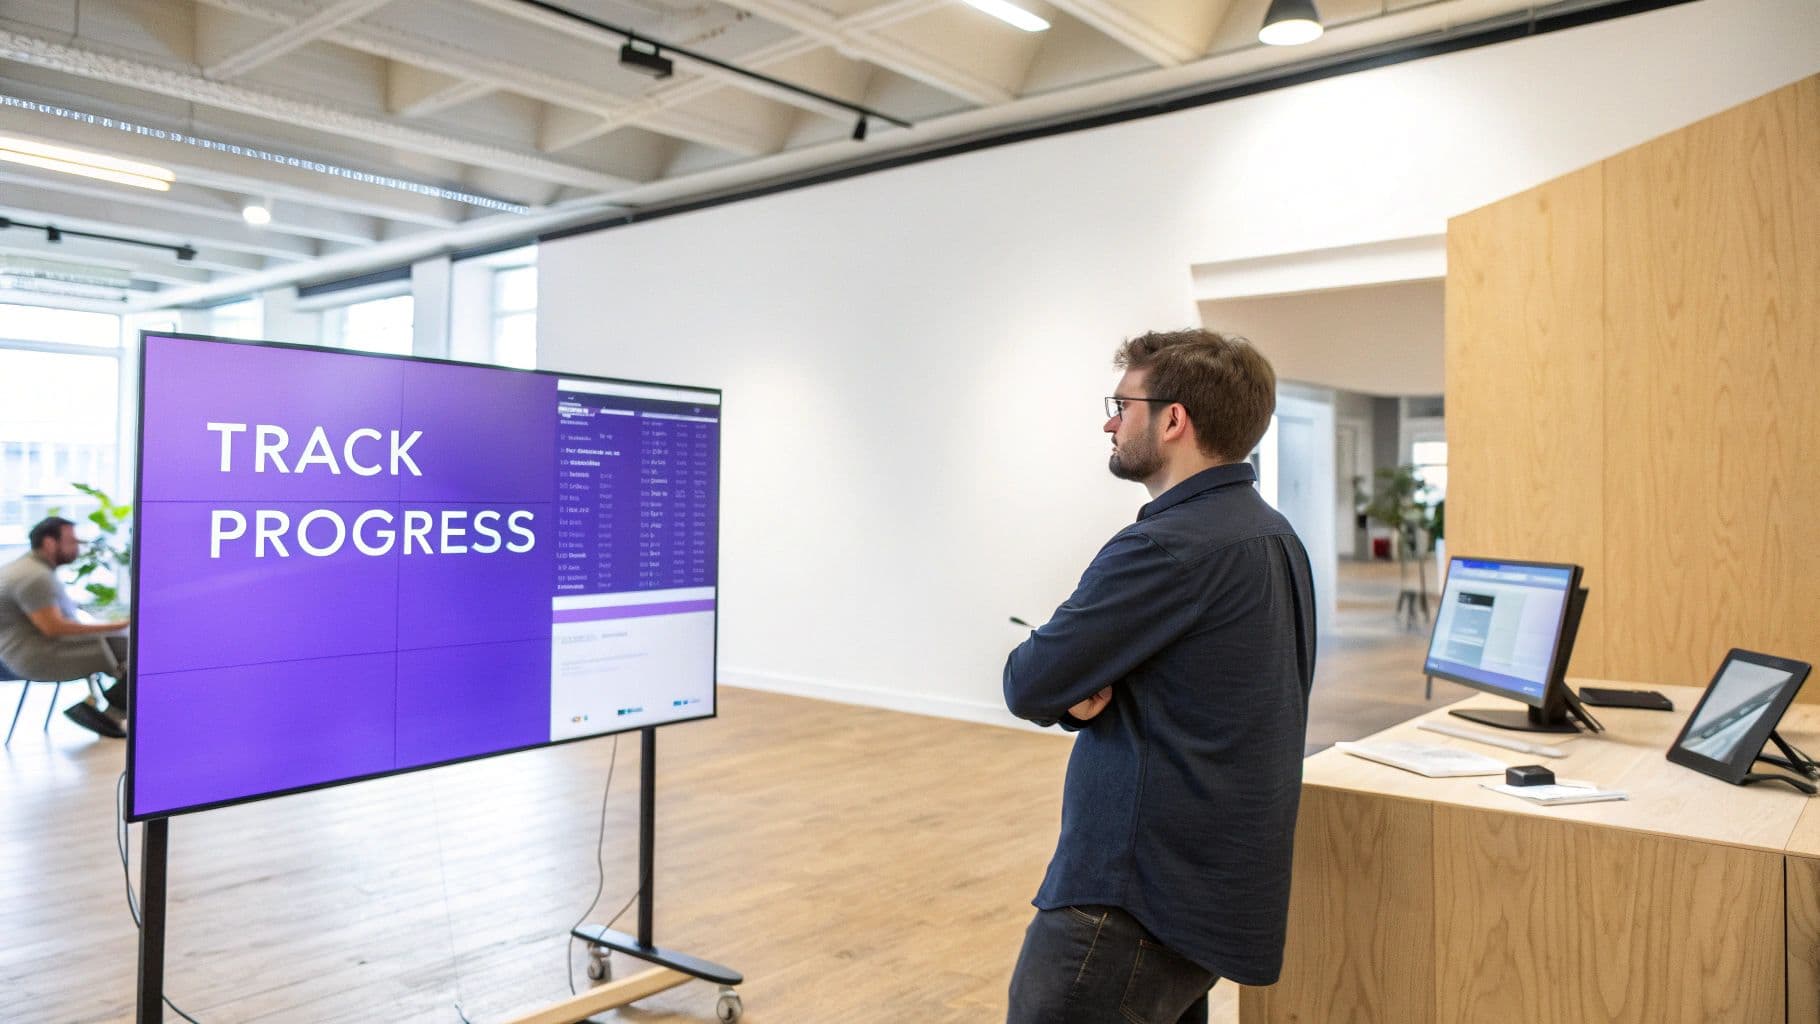
This dashboard from Jellyfish.co is a perfect example of what this looks like in action. You can see how metrics like Cycle Time are visualized alongside team data, giving leaders a clear, at-a-glance story of what’s happening on the ground.
Start Small and Align with Goals
The biggest mistake I see teams make is trying to measure absolutely everything at once. This "metric shock" is a fast track to confusion, resistance, and a program that collapses before it even gets started. The secret? Start small.
Pinpoint one or two of the most significant pain points your team is currently dealing with.
- Is delivery feeling unpredictable? Kick things off with Cycle Time.
- Are users constantly hitting bugs? Put your focus on Change Failure Rate.
- Is your team on the verge of burnout? It might be time to look at Work-in-Progress (WIP) limits.
The first KPIs you choose should be a direct answer to your team's most urgent problems. Of course, to even know what those are, you need to have your objectives straight. This all comes back to a well-defined project scope, which gets everyone pulling in the same direction. For a deeper dive, check out our guide on how to define project scope and get your team aligned from the get-go. When you tie metrics to real-world outcomes, buy-in happens almost automatically.
Gaining Genuine Team Buy-In
For a KPI program to have any chance of succeeding, it has to be a tool for the team, not a weapon for management. The moment engineers think these numbers will be used to judge their performance or stack-rank them, they'll either find a way to game the system or simply check out.
Get your engineering team involved right from the beginning. Run a workshop, talk openly about the current struggles, and decide together which KPIs to track first. When the team feels a sense of ownership over the metrics, they’re far more likely to embrace them as helpful guides.
A Checklist for a Successful KPI Rollout
Just picking a tool and flipping the switch isn't enough. A successful launch depends on clear communication and a real commitment to learning. Use this checklist to guide your rollout.
- Define a Clear "Why": Be crystal clear about the problem you're trying to solve with each KPI. Communicate this purpose over and over again.
- Choose the Right Tools: Pick software that automatically pulls data from your existing systems, like Git and Jira. Trying to track this stuff manually is a surefire way to fail.
- Establish Baselines: You can't know if you're improving if you don't know where you started. Let your new KPI tool run for a few weeks to collect baseline data before you change anything.
- Introduce Metrics Collaboratively: In a team meeting, present the baseline data. Don't frame it as a report card; treat it as the start of a conversation. Ask questions like, "What is this data telling us?" and "Anything here that surprises you?"
- Focus on Trends, Not Absolutes: A single data point is just noise. The real magic happens when you track trends over weeks and months. Celebrate upward trends and get curious about any dips.
- Review and Iterate Regularly: Set aside time every month or so for a quick KPI review. Talk about what you've learned and decide if your chosen metrics are still the right ones. Be ready to adapt as your team's challenges change.
By taking this iterative, team-first approach, you can turn KPIs from something people dread into a shared language for getting better together.
Don't Forget the People Behind the Code
Metrics for speed and stability are crucial, but they don't paint the whole picture. You can have the slickest dashboards and most automated pipelines in the world, but they mean nothing without the creative, talented people who actually build the software. Paying attention to the human side of development isn't just a "soft" skill—it's how you build engineering teams that are both resilient and innovative.
Think about it: your developers are your most valuable asset. Their daily experience directly impacts every single metric you track. When developers are bogged down by clunky tools, confusing processes, or just too much mental juggling, it doesn't just tank morale. You'll see it in the data—cycle times get longer, more bugs slip through, and deployment frequency grinds to a halt.
Bringing Human-Centric KPIs into the Mix
To truly understand the health of your engineering department, you have to measure the experience of the people doing the work. This is where human-centric KPIs come in. They look past the raw code output to get a feel for things like satisfaction, teamwork, and overall well-being.
Frameworks like SPACE (Satisfaction & Well-being, Performance, Activity, Communication & Collaboration, and Efficiency & Flow) offer a great model for this. It’s built on the idea that real productivity isn’t just about churning out features. It’s about creating a sustainable, supportive environment where developers can do their best work.
These kinds of metrics help you answer some really important questions:
- Are our developers actually happy and engaged?
- Are our tools or processes causing more frustration than they're worth?
- How well are people really collaborating and sharing what they know?
- Is the mental workload becoming a roadblock to creative problem-solving?
Getting a handle on these factors can unlock your team's true potential. For instance, if your team is working on a new product, a common point of friction is a lack of clarity around project stages. Our guide on MVP vs prototype can help everyone get on the same page, which reduces confusion and aligns expectations from the start.
How to Actually Measure the Human Element
Unlike code commits, you can't just pull developer satisfaction stats from a Git repository. Gathering this kind of data means you have to be a bit more direct.
- Employee Net Promoter Score (eNPS)
This is a surprisingly powerful metric that comes from one simple question: "On a scale of 0-10, how likely are you to recommend this as a great place to work for your family and friends?" It's becoming clear that employee satisfaction directly impacts productivity. Companies that keep an eye on human-centric KPIs like eNPS often find they have fewer bottlenecks and a higher sprint velocity. You can find more on this topic at Jellyfish.co.
- Regular, Anonymous Surveys
Short, frequent surveys—sometimes called "pulse checks"—are perfect for spotting trends. You can track team morale, how productive people feel, and whether they're happy with your current processes. Be sure to ask specific questions about tools, meeting quality, and psychological safety.
- Qualitative Feedback Sessions
Numbers are great, but stories provide the "why." One-on-one chats and blameless retrospectives give developers a safe space to share what’s genuinely working and what’s causing them pain. This is where you get the context that data alone can't provide.
When you combine hard data like cycle time with qualitative feedback on developer well-being, you get a full 360-degree view of your team's performance. This approach helps you build an organization that not only ships fantastic software but also becomes a place where top talent wants to work and stay.
Common Questions About Software Development KPIs
Even after you get a handle on the theory behind software development KPIs, a whole new set of questions pop up when you try to put them into practice. Getting the rollout right is every bit as important as picking the right metrics in the first place.
This section tackles some of the most common hurdles and questions that engineering teams and their leaders run into. The goal is to give you clear, practical advice to navigate the adoption process, from selecting your first metrics to communicating their value without causing friction.
How Do We Choose The Right KPIs For Our Team?
Picking the right KPIs isn’t about just grabbing a popular list off the internet. It's about looking inward and matching your metrics to your team’s specific goals and biggest headaches. The entire process should kick off with one simple question: What is our biggest challenge right now?
Is delivery painfully slow? Is the system constantly on fire? Are your release dates more of a suggestion than a reality? Your answer is a direct signpost to the metrics that will actually make a difference.
For example, if getting code out the door feels like it takes an eternity, you’ll want to zero in on Cycle Time and Deployment Frequency. But if production bugs and emergency rollbacks are your team's recurring nightmare, then Change Failure Rate and Mean Time to Recovery (MTTR) should be at the top of your list. The magic happens when you connect the metric to a real, tangible problem you’re all trying to solve.
When you're just starting out, a balanced approach is usually best. Try picking one key metric from each of these fundamental areas:
- Delivery Speed: Kick off with a metric like Cycle Time to get a baseline for your end-to-end process speed.
- Quality and Stability: Add a metric like Change Failure Rate to keep a close eye on the reliability of your work.
- Team Health: Don't forget the human element. A simple developer satisfaction survey can tell you if your pace is sustainable.
And remember, your KPIs aren't meant to be set in stone. Plan to review them every quarter. Be ready and willing to adapt them as your team conquers old challenges and new priorities emerge.
How Can We Present KPIs to Management Without Negative Consequences?
This is probably the number one fear teams have, and for good reason. The secret to presenting KPIs to leadership is to frame the conversation around process health, not individual performance. You have to own the narrative from the start.
Never, ever just throw a chart or a number on a slide without context. Always lead with the story behind the data. For instance, if Cycle Time spiked last month, don't just show the ugly upward trend. Explain why it happened. Maybe the team was paying down a mountain of technical debt or wrestling with a complex third-party integration. That context immediately shifts the conversation from, "Why are you all so slow?" to, "Great, how did that strategic work go?"
Always focus on trends over time, not isolated data points. A single number is easily misinterpreted and can trigger unnecessary panic. A trendline over several months, however, shows the real picture—whether you're making steady progress or facing a persistent bottleneck that needs attention. This long-term view is far more useful for strategic decision-making.
Finally, make it a rule to only report on team-level metrics. This reinforces the reality that software development is a team sport and shuts down any temptation to single out individuals. Be proactive about sharing what the team has learned from the data and, crucially, what actions you're taking to improve. This shows leadership you’re not just tracking numbers; you’re a data-informed, proactive team focused on getting better. That’s exactly what they want to see.
Are DORA Metrics The Only KPIs We Should Track?
The DORA metrics—Cycle Time, Deployment Frequency, Change Failure Rate, and MTTR—are an incredible, industry-proven starting point for any software team. They give you a fantastic, high-level snapshot of your delivery speed and operational stability. But no, they shouldn't be the only things you track.
Think of the DORA metrics as the main gauges on your car's dashboard: your speedometer, fuel gauge, and engine temperature. They are absolutely critical for getting where you're going safely and efficiently. But they don't tell you the whole story. They don't tell you if your passengers (your users) are actually enjoying the ride, or if the driver (your team) is on the verge of falling asleep at the wheel.
DORA metrics, by themselves, don't say anything about business impact (Are people even using the features you’re shipping so fast?) or the well-being of your developers. It's entirely possible for a team to achieve "elite" DORA scores while working on features nobody wants, all while teetering on the edge of complete burnout.
That's why it's best to supplement the DORA framework with other KPIs that tie back to your company's bigger picture. This might include:
- Project-level metrics like Sprint Velocity or Burndown charts for better project-level predictability.
- Deeper quality metrics like Bug Density or Code Coverage for a more granular view of software quality.
- Human-centric metrics, like those from the SPACE framework, to ensure your team's pace is sustainable and their work is engaging.
Ultimately, a balanced dashboard that combines DORA with business and people-focused metrics gives you a truly holistic and honest view of your engineering team's effectiveness.
Ready to turn your idea into a market-ready product without the typical delays and uncertainty? Iglu Digital specializes in building high-quality MVPs on a fixed price, agreed up front. We combine rapid development with a user-focused strategy to get your vision into the hands of real users fast. Learn more and start building with us today!