

Mastering Software Development KPIs
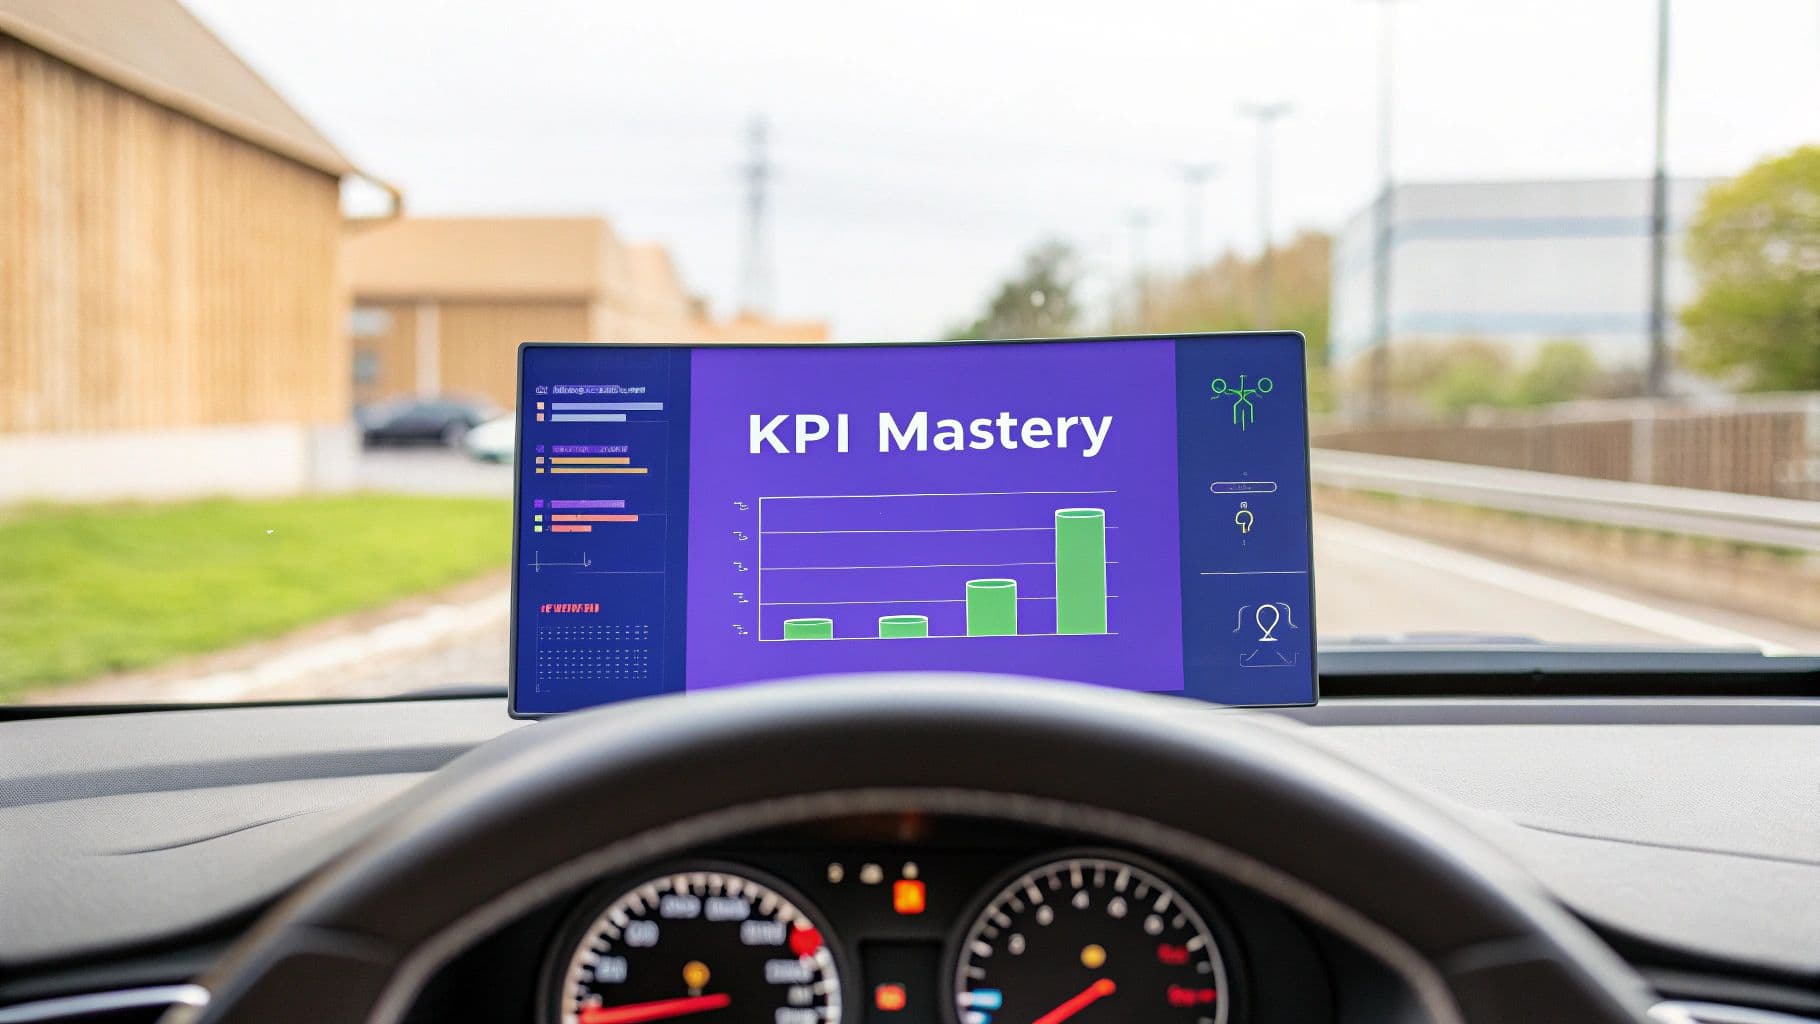
Table of Contents
Software development KPIs are simply quantifiable measures that tell you how your engineering team is performing. Think of them as the tools that turn fuzzy goals into hard, trackable numbers. This helps everyone make smarter decisions and ensures the team's work is actually pushing the business forward.
Why Software Development KPIs Are Your Team's Dashboard
Ever tried flying a plane without an instrument panel? You’d be moving, sure, but you'd have no clue about your speed, altitude, or how much fuel you have left. Running a software team without Key Performance Indicators (KPIs) is a lot like that—you're essentially flying blind, relying on gut feelings instead of real data.
Software development KPIs are your team’s dashboard. Just like a driver keeps an eye on the speedometer and fuel gauge, engineering leaders use KPIs to watch things like team velocity, product health, and any potential roadblocks. These metrics give you the visibility you need to get from vague ideas to clear, measurable targets.
For instance, a broad goal like "improve code quality" doesn't give anyone much to work with. But tie it to a KPI, and it suddenly becomes a concrete objective. It turns into a specific target, like "reduce our bug rate by 20% this quarter" or "get the Change Failure Rate below 5%." This kind of clarity is what gets everyone on the same page about what success actually looks like. It also shows the team exactly how their process improvements are making a difference.
From Guesswork to Guided Strategy
Without data, big decisions often come down to intuition or whoever has the strongest opinion. That’s a risky way to operate and it definitely doesn't scale. KPIs help you build a culture where evidence, not just gut feelings, drives your strategy. They provide clear answers to critical questions:
- Are we getting faster? Look at your Cycle Time from the first commit to deployment.
- Is our quality getting better? Track the number of bugs that pop up after a release.
- Are our deployments reliable? Measure your Deployment Frequency and Change Failure Rate.
This data-first mindset is more important than ever. The global software development market is on track to explode from 203 billion** in 2022 to a staggering **1.45 trillion by 2031. To keep up, over 30% of teams have already set up dedicated departments just for quality and security, highlighting just how critical solid metrics have become.
At the end of the day, software development KPIs build a culture of continuous improvement. When everyone has a clear, shared understanding of performance, it’s easier to spot bottlenecks, celebrate wins, and make proactive changes before small issues become big problems. This is the bedrock of any methodology focused on iterative progress. To dive deeper into these ideas, take a look at our guide to essential Agile development terms. KPIs are the instruments that guide your team from an uncertain starting point to a predictable and successful destination.
The Four Pillars of Engineering Performance
Trying to measure engineering performance with a single, magic number is a recipe for disaster. It’s like trying to judge the health of a forest by looking at just one tree. A truly effective approach needs a balanced perspective, which is where a holistic framework comes in. We can break down software development KPIs into four essential pillars.
This "balanced scorecard" approach ensures that you aren't sacrificing one critical area for another. Chasing speed at all costs can tank quality and burn out your team, while over-indexing on quality can slow delivery to a crawl. Each pillar is vital for sustainable growth and predictable delivery.
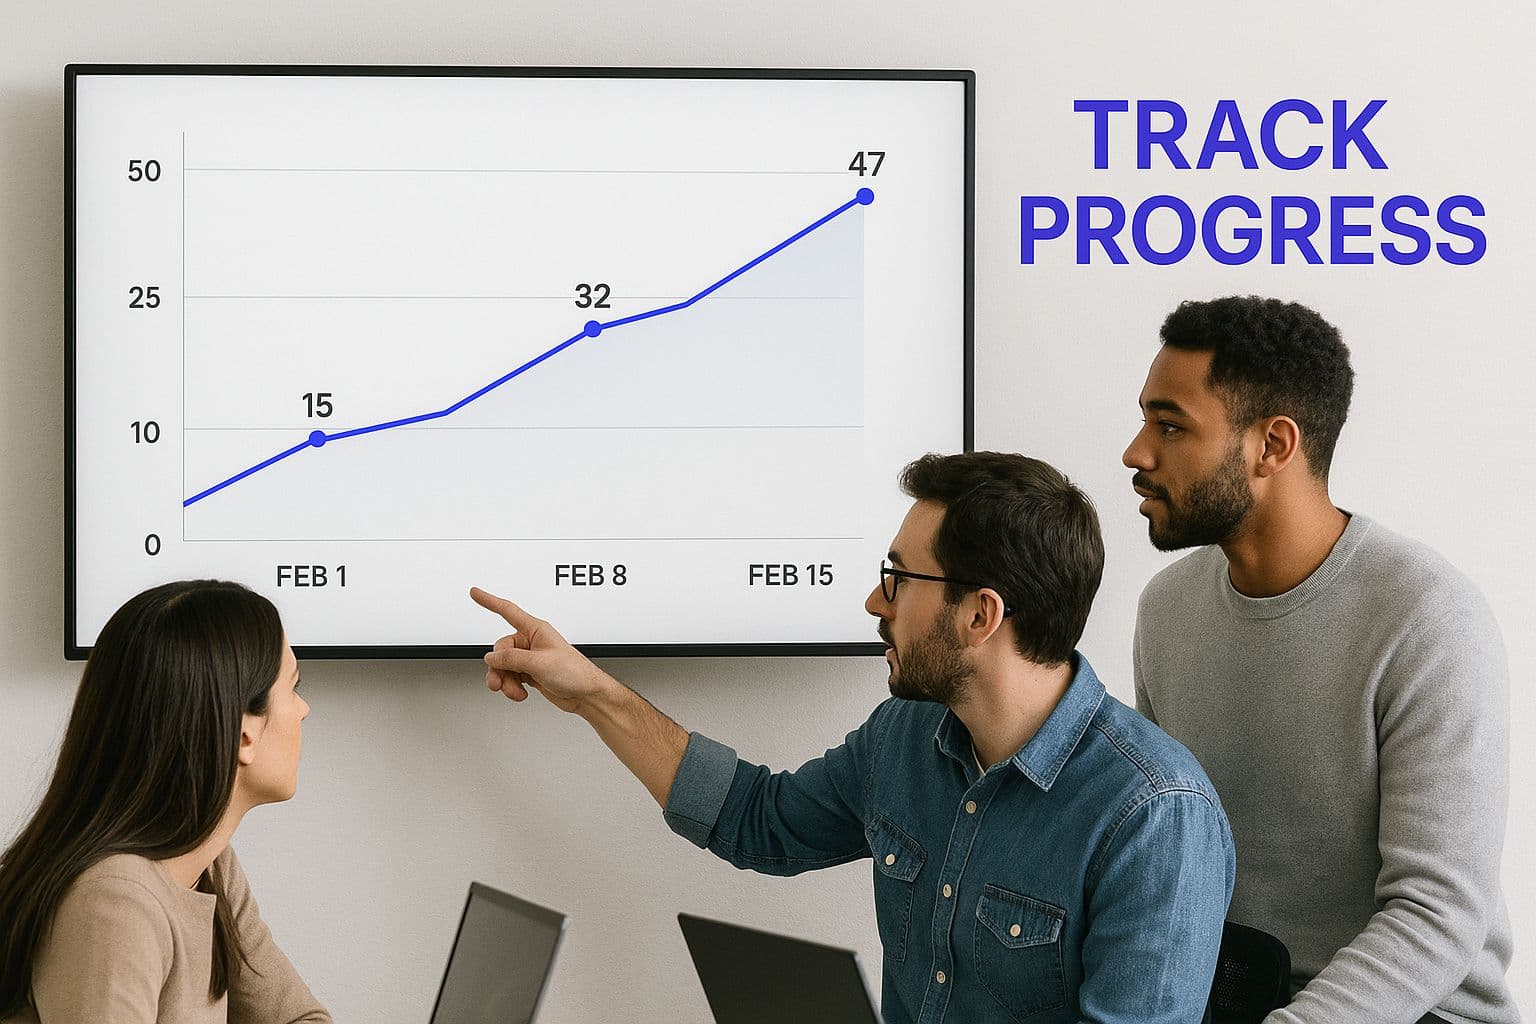
This is where visualizing data becomes so important. When a team can see their metrics on a shared dashboard, they can spot imbalances and make smart, data-driven decisions to keep the entire system healthy.
Let’s dive into what each of these pillars actually represents.
Pillar 1: Speed
Speed is all about how fast you can get value into the hands of your users. This isn't just about how quickly someone can type code; it's about the efficiency of your entire workflow, from the initial idea all the way to production. When you measure speed, you're really measuring your team's agility.
Two key metrics really define this pillar:
- Cycle Time: This tracks the total time it takes from the first code commit for a feature until that code is live. A short cycle time is a sign of a well-oiled machine.
- Deployment Frequency: How often does your team ship code? High-performing teams often deploy multiple times a day, which actually reduces risk by making each release small and manageable.
Pillar 2: Quality
Shipping fast means nothing if the product is riddled with bugs. The quality pillar is focused on the stability and reliability of your software. High quality builds trust with your users and, just as importantly, cuts down on the unplanned work your team has to do to fix things that are broken.
To keep an eye on quality, you need to track specific KPIs:
- Change Failure Rate (CFR): What percentage of your deployments cause a production failure that requires a hotfix or a rollback? Elite teams keep their CFR under 1%.
- Bug Rate: This is a straightforward count of the bugs discovered after a release. It’s a direct reflection of how effective your testing and code review processes are.
Pillar 3: Efficiency
Let’s be clear: efficiency is not about getting developers to work longer hours. It's about removing friction, waste, and bottlenecks from the process so they can spend more of their time on high-impact, meaningful work.
A great, and often overlooked, metric for this is Code Churn. This KPI measures how much code gets rewritten or deleted shortly after it's committed. High churn can point to all sorts of problems—unclear requirements, technical confusion, or a broken review process. Fixing these hidden drags on the system is what true efficiency is all about.
Pillar 4: Team Health
None of the other pillars matter if your team is miserable and burning out. Team Health is arguably the most critical pillar for any kind of long-term success. It’s all about fostering a sustainable and supportive environment where people can thrive.
While it can feel a bit abstract, you can absolutely track it.
- Developer Satisfaction: Use regular, anonymous surveys to get a real pulse on morale and engagement.
- Workload Balance: Look at data like pull request distribution. Is one person on the team consistently carrying a much heavier load? That’s a major burnout risk.
To help tie all this together, think of the pillars as a system of checks and balances. The table below summarizes how they work together to give you a complete picture of your engineering organization's health and performance.
The Four Pillars of Software Development KPIs
| Metric Pillar | Core Focus | Key Question It Answers | Example KPIs |
|---|---|---|---|
| Speed | How quickly value is delivered to users. | "Are we moving fast enough?" | Cycle Time, Deployment Frequency |
| Quality | The stability and reliability of the code. | "Are we building the right thing, and building it right?" | Change Failure Rate (CFR), Bug Rate |
| Efficiency | The smoothness of the development process. | "Are we wasting effort or facing hidden roadblocks?" | Code Churn, Rework Rate |
| Team Health | The well-being and sustainability of the team. | "Is our team set up for long-term success?" | Developer Satisfaction, Workload Balance, Retention Rate |
By monitoring these four pillars in concert, you avoid the trap of optimizing one area at the expense of another. This balanced approach is what ultimately leads to a healthier, more productive team and a much better product.
Tracking the Metrics That Actually Matter

Alright, enough with the theory. The real magic happens when you start applying KPIs to your team's workflow. While you could track dozens of different numbers, a few key metrics have proven themselves time and again as the most reliable indicators of a high-performing engineering team.
Think of these not as just numbers on a dashboard, but as the vital signs of your team's speed, quality, and overall health. By zeroing in on this core set, you get a clear, actionable picture of your development process without drowning in data. Let's dig into the KPIs that truly move the needle.
Cycle Time From First Commit to Production
Imagine a feature request is a package you need to ship. Cycle Time is the total time that package is in your hands—from the moment a developer writes the first line of code to the second it’s live for customers. It's arguably the most critical efficiency metric because it reveals the health of your entire development pipeline.
A long Cycle Time is a smoke signal for hidden bottlenecks. For example, if your team codes a feature in two days but it sits in a code review queue for another three, you don't have a coding problem; you have a process problem. Elite teams often crush this, with Cycle Times under 26 hours, while others might take a week or more. The goal is simple: shorter cycles mean you're shipping value and getting feedback faster.
Lead Time From Idea to Value
While Cycle Time focuses on the technical part of the journey, Lead Time zooms out to capture the entire picture. This metric starts the clock the moment an idea is formally requested and stops only when that idea is a live feature in your customer's hands. It includes everything—planning, design, prioritization, coding, and deployment.
If your Cycle Time is quick but your Lead Time is dragging, the problem usually lies outside the code itself. Maybe ideas are getting bogged down in endless approval meetings or the requirements aren't clear enough, causing delays before a single developer even starts typing. Tracking Lead Time helps bridge the gap between your engineering team and the wider business operations.
Deployment Frequency
Simply put: how often do you ship code to production? That’s Deployment Frequency. This KPI is a fantastic barometer for your team's agility and confidence. High-performing teams might deploy multiple times a day, while less mature teams might be stuck on a once-a-month release schedule.
Here's the thing: smaller, more frequent deployments are actually less risky. Each release has fewer changes, so if something breaks, it’s much easier to find the culprit. This approach allows teams to respond to market changes quickly and deliver a steady, predictable stream of value to users.
Bug Rate and Mean Time To Recovery
Look, no one writes perfect code. Bugs are going to happen. What really matters is how you deal with them. The Bug Rate measures the number of defects discovered after a release, giving you a direct look at the effectiveness of your testing and QA. A consistently high Bug Rate is a red flag, suggesting you need to beef up automated testing or refine your code review process.
But a zero Bug Rate isn't the holy grail either. It could just mean your testing isn't catching things before they hit users. That's why top-tier teams focus on resolving bugs fast. In fact, many resolve over 80% of bugs within 48 hours of being found. You can dive deeper into how elite teams handle defects by checking out recent software development statistics.
When a bug does cause a production failure, Mean Time to Recovery (MTTR) becomes your most important metric. It measures how quickly your team can restore service after a system goes down. A low MTTR shows your team is resilient and has a solid incident response plan, which is crucial for keeping user trust. Elite teams often recover in under an hour, proving they have robust monitoring and rollback systems in place. By keeping an eye on these software development KPIs, you can stop guessing and start making targeted improvements that deliver real results.
Choosing and Implementing KPIs That Work for You

Knowing which software development KPIs to track is one thing. Getting your team to actually embrace them is another challenge entirely. The best metrics strategy is one your team genuinely uses and believes in—not as tools for judgment, but as a shared compass to make everyone’s work more impactful.
Rolling out a dozen new metrics at once is the fastest way to overwhelm your team and kill the initiative before it starts. Instead, start small. Focus on just 3-4 foundational metrics that give you a clear signal on performance without creating a reporting nightmare.
For most teams, the DORA metrics (Cycle Time, Deployment Frequency, Change Failure Rate, and MTTR) are the perfect place to begin. The idea is to build momentum with a few high-value KPIs, making the data digestible and helping everyone see the immediate benefits of a more data-informed workflow.
Connect Metrics to Goals with GQM
To make sure you’re tracking what truly matters, there's a simple but powerful framework called Goal-Question-Metric (GQM). It’s a fantastic way to avoid vanity metrics by tying every single KPI directly back to a high-level business objective.
Here’s how it works in three straightforward steps:
- Goal: Start with what the business is trying to achieve. Be specific. (e.g., "We need to boost customer satisfaction by making our product more stable.")
- Question: Ask questions that will tell you if you’re getting closer to that goal. (e.g., "Are our latest deployments causing new bugs?" or "How fast are we at fixing critical issues when they pop up?")
- Metric: Finally, pick the specific KPIs that will answer those questions. (e.g., "Let's track our Change Failure Rate" and "We need to measure our Mean Time to Recovery.")
This process guarantees that every metric on your dashboard has a real purpose. It shifts the conversation from "what should we measure?" to "what do we need to know to win?"
Get Your Team on Board
The single biggest obstacle to a successful KPI program is a lack of team buy-in. If developers feel like metrics are just there to micromanage or rank them, they’ll either tune out or find clever ways to game the system. Real adoption happens when the team sees KPIs as a tool for their benefit.
Frame the whole initiative around improvement, not evaluation. Use the data to spark helpful conversations during retrospectives and planning. For example, a rising Cycle Time isn't a reason to point fingers; it's a perfect opportunity to ask, "What's slowing us down, and how can we fix it together?"
This collaborative approach is fundamental to building a healthy, high-performing engineering culture. This focus on clear communication and shared goals is a cornerstone of effective development, which you can explore further in our guide on running better Agile methodology meetings.
Select the Right Tools for the Job
Manually tracking KPIs in spreadsheets is a recipe for frustration and bad data. Today’s engineering teams rely on specialized tools to automate data collection and create live, transparent dashboards that everyone can see.
Here are a few popular options that can help:
- Jira and Azure DevOps: These project management giants have built-in reporting features that are great for tracking metrics like sprint predictability and work-in-progress.
- LinearB and Flow: These tools plug directly into your Git repositories (like GitHub or Bitbucket) and project management systems to automatically calculate key metrics like Cycle Time and Code Churn.
- Git Analytics Tools: Platforms that analyze your version control history can uncover patterns in code review times, pull request sizes, and even developer workload distribution.
By picking the right tools, you take the manual grunt work out of data collection. This frees up your team to focus on what the numbers are actually telling them and makes your KPI program a sustainable part of your team’s routine.
Turning Data Into Action with KPI Dashboards
Raw data on its own is just noise. A spreadsheet crammed with numbers isn't going to tell you much, and it certainly won't inspire your team to take action. The real magic happens when you bring those software development KPIs to life, turning them into a clear, visual story. That's exactly what a good KPI dashboard does—it creates a single source of truth for your team's performance, updated in real time.
Think of it like the dashboard in your car. You don't need to know the raw electrical output of the alternator; you just need to see the speedometer and the fuel gauge to know if you're on track. A software development dashboard works the same way, translating complex metrics into simple charts and graphs that make trends instantly clear. You can see where you're speeding up and where you're running on empty.
Tailoring Dashboards for Different Audiences
Not everyone on the team needs the same firehose of information. A huge part of building a successful dashboard is creating different views for different people. This ensures everyone gets the insights they need without getting lost in the weeds. A focused approach like this is also essential for effective resource allocation in project management, because it gets different teams looking at the data that matters most to them.
Here’s a simple way to break it down:
- For Developers: They need a ground-level view. Think real-time metrics like Pull Request review times or active Cycle Times. This helps them see and smash bottlenecks as they pop up in their day-to-day work.
- For Team Leads: They're looking at the bigger picture, but on a sprint-by-sprint basis. Dashboards showing trends in Sprint Predictability or Bug Rate give them the context to lead better retrospectives and plan more effectively.
- For Leadership: They need the 30,000-foot view. High-level dashboards that track long-term DORA metric trends or show how engineering work is impacting business goals give them a strategic look at the organization's overall health.
Designing for Insight, Not Just Information
A great dashboard doesn't just show you data; it makes you want to do something about it. The amount of data in the world is exploding—it’s expected to grow by 61% by 2025—which makes clear visualization more important than ever. Companies are quickly catching on, using dashboards to track metrics like Lead Time and Flow Efficiency to see how they stack up against the competition and what their customers really need. If you want to see how others are tackling this, it's worth checking out some emerging KPI dashboard trends.
Always prioritize trends over single-point-in-time metrics. A standalone number is just a snapshot, but a trendline tells a story about whether you're improving or falling behind. This lets your team catch negative patterns early, celebrate real progress, and make decisions based on what's actually happening, building a truly data-informed culture from the ground up.
Common KPI Traps and How to Avoid Them
It's easy to get excited about implementing software development KPIs, but it’s just as easy to fall into a few common traps. I’ve seen it happen time and again: well-intentioned metrics end up causing more frustration than clarity, eroding trust, and even rewarding the wrong behaviors.
Knowing what these pitfalls look like is the first step to building a healthy, data-informed engineering culture.
The Lure of Vanity Metrics
One of the biggest mistakes is getting fixated on vanity metrics. These are the numbers that look impressive on a slide deck but tell you absolutely nothing about performance or business value. Think raw lines of code or the sheer number of commits.
These metrics are so easy to game. They often reward busywork over thoughtful, efficient problem-solving. A developer could write 1,000 lines of bloated, inefficient code to solve a problem that a more experienced engineer could solve in 100 elegant lines. Who actually delivered more value?
Weaponizing Data and Killing Trust
Another huge danger is weaponizing data. KPIs should be a flashlight, not a hammer. When managers use metrics to publicly rank individuals or assign blame, it creates a culture of fear that crushes psychological safety.
Imagine a team's Change Failure Rate spikes. A manager could use that data to single out the developer whose recent commit was involved. Or, they could use it to ask, "What’s going on in our process that’s making it harder to ship reliable code?" The first approach destroys trust; the second builds it.
Focusing on Output Over Outcomes
This is a classic. We get so wrapped up in what we're building that we forget why we're building it. This trap is all about prioritizing output (the volume of stuff done) over outcomes (the actual value delivered to a customer).
When you're stuck in the output mindset, you celebrate closing tickets and hitting story point targets, even if the feature you shipped completely misses the mark with users. To avoid this, always tie your engineering KPIs back to the bigger picture—the real business goals.
Here are a couple of examples I see all the time:
- The Trap: Measuring individual story point velocity to compare developers.
- The Trap: Rewarding the developer who merges the most pull requests.
Setting Unrealistic Targets
Finally, resist the urge to set aggressive, top-down targets without talking to your team. When leaders hand down an impossible goal like, "cut Cycle Time in half by next month," developers are forced to cut corners.
They might skip code reviews, skimp on testing, or push out half-baked work just to make the numbers look good. This not only tanks quality but also paves a fast road to burnout.
A much better approach is to first establish a baseline for your KPIs. From there, work with the team to set realistic, incremental goals for improvement. This gives everyone a sense of ownership and ensures your progress is sustainable for the long haul.
Common Questions About Software Development KPIs
Even with a solid plan, jumping into the world of software development KPIs can feel a bit daunting. Practical questions always come up. How many metrics are too many? And what do you do when a number starts trending in the wrong direction? Let’s tackle some of the most common questions we hear.
How Many KPIs Should We Track at Once?
When it comes to metrics, less is almost always more—especially when you’re just getting started. The whole point is to find clarity, not get buried in data. Trying to juggle a dozen KPIs at once is a surefire way to cause confusion and burnout.
A great starting point for most teams is to focus on just 3-4 core metrics. Think of it as your dashboard's "check engine" lights. The DORA metrics are a perfect example of this in action:
- Cycle Time
- Deployment Frequency
- Change Failure Rate
- Mean Time to Recovery (MTTR)
This small set gives you a fantastic, balanced view of your team's velocity and stability without overwhelming anyone. You can always layer in more specific metrics later on as your team gets more comfortable with the process.
What if a Metric Is Going in the Wrong Direction?
First, don't panic. A dipping metric isn’t a failure; it’s a signal. The number itself isn't the problem—it's just a symptom of something happening under the hood.
For instance, if your Cycle Time starts creeping up, it’s a clear sign to look for a bottleneck. Is the code review process creating a logjam? Are user stories too vague? Use the data to spark a collaborative, blameless discussion during your next team retrospective. It’s all about finding the root cause together.
Should We Compare Our KPIs Against Other Teams?
This is a tricky one. While looking at industry benchmarks can give you a general sense of where you stand, comparing KPIs between your own internal teams often does more harm than good. Each team is unique—they have different projects, different challenges, and different dynamics. Their KPIs will naturally look different.
Instead of pitting teams against each other, focus on each team's own progress over time. Is Team A improving its own Cycle Time month over month? That’s a huge win. The real goal is continuous improvement for each team, not turning performance into an internal competition.
Ready to build your next product with a team that values data-driven improvement? Iglu Digital specializes in turning great ideas into market-ready MVPs for a price agreed before a line of code is written, using a transparent and efficient development process. Transform your concept into a tangible product with us.