

8 Essential KPI for Software Development to Track in 2025

Table of Contents
In the fast-paced world of software development, it's easy to get lost in the hustle of writing code and shipping features. But how do you know if your team is truly effective? The answer lies in tracking the right Key Performance Indicators (KPIs). Moving beyond outdated vanity metrics like lines of code, a well-chosen kpi for software development provides a clear, data-driven view of your team's efficiency, quality, and overall impact on business goals. These metrics are not just about measuring output; they are about understanding and improving the entire development lifecycle.
This guide cuts through the noise to focus on the metrics that matter most. We will explore eight essential KPIs, from Code Coverage and Deployment Frequency to Lead Time and Mean Time to Recovery (MTTR). For each metric, you'll get a clear definition, the calculation method, and actionable advice on how to implement and track it effectively. Whether you're a startup founder aiming for a rapid MVP, a CTO building a high-performing engineering culture, or an investor tracking progress, mastering these KPIs is crucial. They provide the insights needed to optimize processes, enhance product quality, and deliver tangible value to your customers faster.
1. Code Coverage
Code Coverage is a foundational software testing metric that quantifies the percentage of your source code executed during automated tests. Think of it as a map of your testing efforts; it shows you precisely which lines, branches, and functions your tests have "visited" and, more importantly, which they have missed. This metric is a crucial KPI for software development because it provides a tangible measure of test suite thoroughness, helping teams identify untested areas that are vulnerable to bugs.
How Code Coverage Works
When you run your automated tests, code coverage tools monitor which parts of your application's code are activated. The result is a report, often expressed as a percentage. For instance, a 75% line coverage means three-quarters of your code lines were executed during the test run. This insight is invaluable for preventing regressions and ensuring new features are adequately vetted before deployment.
Major tech companies rely on this KPI to maintain quality. Google, for example, often maintains over 85% code coverage for its critical projects, while Microsoft Azure mandates 80% coverage for its most essential components. These benchmarks highlight its importance in building robust, reliable software.
The following infographic summarizes the key types of coverage and a practical target to aim for.
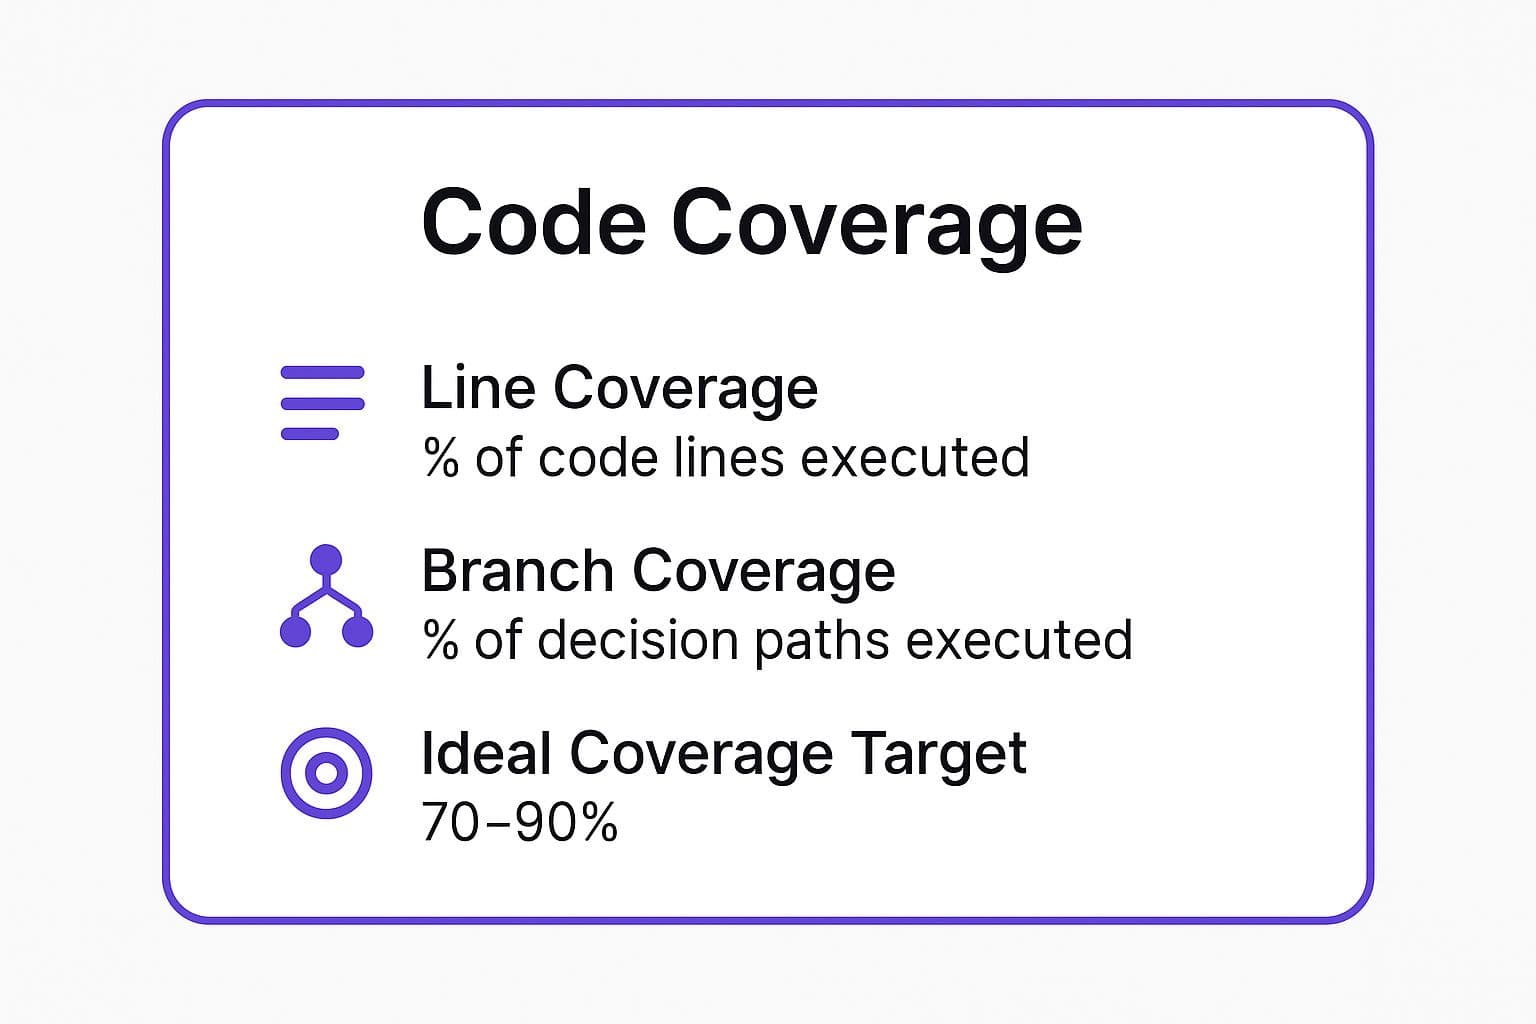
As the infographic shows, focusing on line and branch coverage within a 70–90% range provides a strong foundation for a high-quality codebase.
Actionable Tips for Implementation
To make code coverage an effective KPI, integrate it thoughtfully into your workflow.
- Focus on Critical Logic First: Don't chase a 100% score. Instead, prioritize writing tests for complex business logic, critical user paths, and areas prone to frequent changes.
- Integrate into CI/CD: Set up your CI/CD pipeline to automatically run coverage analysis with every build. You can even configure it to fail a build if coverage drops below a certain threshold, preventing untested code from reaching production.
- Combine with Other Metrics: Code coverage tells you what code was run, not if it was tested correctly. Pair it with other quality KPIs, like bug density or escape defects, for a more holistic view of software quality.
2. Deployment Frequency
Deployment Frequency measures how often a team successfully deploys code to production. It is a core DevOps metric that serves as a powerful indicator of a team's agility, workflow efficiency, and ability to deliver value to users rapidly. A high deployment frequency signals a mature, automated, and reliable development process, making it an essential KPI for software development for teams aiming to iterate quickly and respond to market changes.

How Deployment Frequency Works
This KPI is calculated by tracking the number of deployments to the production environment over a specific period. For instance, a team deploying five times a week has a much higher frequency than one deploying once a month. This metric, popularized by the DORA (DevOps Research and Assessment) research and the book Accelerate, directly correlates with high-performing technology organizations.
Elite performers in the industry demonstrate the power of this KPI. Amazon famously deploys new code every 11.7 seconds on average, while Netflix executes thousands of deployments daily. These benchmarks show that frequent, smaller releases reduce risk and accelerate the feedback loop, enabling teams to build better products faster. Utilizing modern development approaches is key to achieving this, and you can learn more about cloud-based development services here.
Actionable Tips for Implementation
To improve deployment frequency, focus on creating a streamlined and automated pipeline.
- Automate Everything: The foundation of high deployment frequency is a fully automated testing and deployment pipeline. Remove manual steps to reduce errors and increase speed from commit to production.
- Implement Feature Flags: Use feature flags (or toggles) to deploy new functionality to production in a disabled state. This decouples deployment from release, allowing you to ship code frequently without impacting users until you're ready.
- Start Small and Iterate: Don't aim for Netflix's level overnight. If you deploy monthly, target weekly deployments. Once that is stable, aim for daily. Gradual improvements are more sustainable and less disruptive.
- Monitor Quality: High frequency should never come at the expense of quality. Track deployment frequency alongside other KPIs like Change Fail Rate and Mean Time to Recovery (MTTR) to ensure stability.
3. Lead Time
Lead Time measures the total duration from the moment a new work item, like a feature request or bug report, is created until it is fully deployed to production and available to end-users. This end-to-end metric provides a holistic view of your development process efficiency, encompassing everything from initial ideation to final delivery. Lead Time is a powerful KPI for software development because it reveals how quickly your team can respond to customer needs and deliver value.

How Lead Time Works
This KPI is calculated by measuring the time elapsed between two key points: "Commit" (when work begins) and "Deploy" (when code is live). A shorter Lead Time indicates a more agile, responsive, and efficient development pipeline, which is a significant competitive advantage. For a deeper understanding, you can explore the nuances of software development KPIs and how they connect.
Many top-tier companies have transformed their operations by focusing on this metric. For instance, Spotify significantly reduced its average lead time from weeks to just days by optimizing its CI/CD pipelines and team autonomy. Similarly, Capital One achieved a 75% improvement in its lead time by embracing a comprehensive DevOps transformation, allowing it to innovate much faster.
Actionable Tips for Implementation
To effectively use Lead Time as a performance indicator, integrate it with a focus on continuous improvement.
- Segment by Work Type: Track lead time for different kinds of work, such as new features, bug fixes, and technical debt, separately. This helps you understand the unique flow for each and set more realistic, context-aware targets.
- Visualize Your Workflow: Use value stream mapping to chart every step from request to deployment. This visualization makes it easier to spot and eliminate bottlenecks, such as long code review queues or manual testing phases.
- Automate, Automate, Automate: The biggest gains in reducing lead time often come from automating repetitive tasks. Focus on automating builds, testing, and deployment to minimize manual handoffs and idle time.
4. Defect Density
Defect Density is a critical quality metric that measures the concentration of confirmed defects within a software component or system. It is typically calculated as the number of defects per thousand lines of code (KLOC) or per function point, providing a standardized way to assess and compare code quality across different modules, applications, or even entire projects. This metric serves as a powerful KPI for software development because it offers a direct, quantitative measure of codebase health, helping teams pinpoint high-risk areas that require refactoring or more rigorous testing.
How Defect Density Works
To calculate defect density, you divide the total number of known defects found in a specific period by the size of the code. For example, if a 20,000-line codebase (20 KLOC) has 40 confirmed defects, the defect density is 2.0 defects per KLOC. This simple calculation provides an objective benchmark for quality, moving beyond subjective assessments and enabling data-driven decisions about resource allocation for testing and bug-fixing efforts.
Leading organizations use this KPI to enforce stringent quality standards. For instance, NASA's safety-critical shuttle software famously achieved a density of just 0.1 defects per KLOC. In the commercial software world, mature products from companies like Microsoft often aim for a density between 0.5 and 1.0 defects per KLOC, demonstrating a commitment to reliability.
Actionable Tips for Implementation
To effectively use defect density as a KPI, integrate it with context and clear goals.
- Track Pre and Post-Release Defects: Separate your defect tracking into two categories: those found before release (by QA) and those found after (by users). This helps you measure the effectiveness of your internal testing processes and the real-world quality of your product.
- Consider Code Complexity: A high defect density in a simple module is more alarming than the same density in a highly complex one. Use cyclomatic complexity scores alongside defect density to get a more nuanced understanding of code quality.
- Set Realistic Benchmarks: Don't aim for zero defects immediately. Instead, set targets based on industry standards for your domain and the criticality of the specific application. A non-critical internal tool can tolerate a higher density than a customer-facing payment gateway.
5. Mean Time to Recovery (MTTR)
Mean Time to Recovery (MTTR) is a critical reliability metric measuring the average time it takes to restore service after a system failure or production incident. It directly reflects a team's ability to respond to and resolve issues, which is fundamental to maintaining user trust and business continuity. This metric is a vital KPI for software development because it shifts focus from preventing all failures to building resilient systems that can recover quickly, minimizing downtime and user impact.
How Mean Time to Recovery (MTTR) Works
MTTR is calculated from the moment an incident is detected until the affected service is fully restored and operational for users. This includes the time spent on diagnostics, implementing a fix, and deploying the solution. A low MTTR indicates a mature incident response process and a robust, well-instrumented system. Minimizing this downtime is crucial for protecting revenue and brand reputation.
Leading tech organizations prioritize low MTTR to ensure high availability. Google Cloud, for instance, maintains an MTTR of under 30 minutes for many of its core services, while Netflix leverages extensive automation to achieve sub-hour recovery times. Similarly, Atlassian significantly reduced its MTTR from hours to minutes by investing in advanced monitoring and streamlined incident response protocols.
Actionable Tips for Implementation
To effectively use MTTR as a KPI, focus on improving your team’s response capabilities.
- Invest in Comprehensive Monitoring and Alerting: You can't fix what you don't know is broken. Implement tools that provide immediate, context-rich alerts when an issue occurs, reducing the time it takes to detect and diagnose problems.
- Implement Automated Incident Response: Use runbooks and automated scripts to handle common failure scenarios. Automation can drastically cut down recovery time by executing predefined recovery steps without manual intervention.
- Conduct Regular Incident Response Drills: Practice makes perfect. Run "game day" exercises or chaos engineering experiments to simulate failures and allow your team to rehearse their response in a controlled environment, identifying weaknesses before a real incident occurs.
6. Sprint Burndown
Sprint Burndown is a visual chart that tracks the work remaining against the time available in a sprint. It provides a day-by-day snapshot of whether the team is on track to complete its committed work. This chart is a cornerstone KPI for software development in Agile environments, as it offers immediate, transparent feedback on progress and helps identify potential impediments before they derail the sprint goal.
How Sprint Burndown Works
At the start of a sprint, the team estimates the total effort for all planned tasks, typically in story points or hours. This total becomes the starting point on the chart's vertical axis, while the horizontal axis represents the sprint's duration in days. As the team completes work, the remaining effort is updated daily, creating a "burndown" line that trends downward. An ideal line shows steady progress, while a flat or upward-trending line signals a problem.
Leading tech companies use this KPI to maintain delivery predictability. Spotify, for instance, relies on burndown charts to give squads autonomy while tracking progress, and Salesforce combines it with velocity data to forecast future sprint capacity. These practices show its value in fostering accountability and proactive problem-solving. You can explore various agile approaches in more detail to see how this fits into the bigger picture of different agile methodology types.
Actionable Tips for Implementation
To leverage Sprint Burndown effectively, turn the data into a conversation starter for your team.
- Update Task Status Daily: For the chart to be accurate, team members must update the status of their work at the end of each day. This discipline makes the burndown a reliable source of truth.
- Focus on Trends, Not Daily Fluctuations: A single day of slow progress is not a crisis. Look at the overall trend. Is the team consistently behind? This indicates a systemic issue like over-commitment or unresolved blockers.
- Address Scope Changes Immediately: If new work is added mid-sprint (scope creep), it must be reflected in the chart. This makes the impact visible to everyone and forces a discussion about priorities.
- Use Data to Improve Estimation: If the burndown consistently shows the team finishing early or late, use this feedback to refine estimation practices for future sprints, leading to more predictable outcomes.
7. Technical Debt Ratio
Technical Debt Ratio is a critical code quality metric that quantifies the cost of rework caused by choosing an easy solution now instead of using a better approach that would take longer. It represents the ratio of the time required to fix quality issues in the codebase versus the total time it took to build it. This metric is a powerful KPI for software development because it translates abstract quality problems into a tangible cost, helping teams justify refactoring efforts and make informed decisions about long-term code maintainability.
How Technical Debt Ratio Works
This KPI is typically calculated by static analysis tools that scan the codebase for code smells, complexity, duplication, and other quality violations. These tools estimate the "remediation cost" (the time needed to fix the issues) and compare it to the "development cost" (the time it would take to write the code from scratch). A ratio of 5% means that for every 100 hours of development, an additional 5 hours would be needed to clean up the resulting debt.
Leading tech organizations use this metric to manage codebase health proactively. For instance, Ericsson successfully reduced its technical debt ratio from a high of 25% down to a manageable 5% through systematic refactoring initiatives. Similarly, Adobe tracks this ratio across its product lines to guide architectural improvements and prevent quality degradation.
Actionable Tips for Implementation
To effectively manage technical debt, integrate this KPI into your team's regular health checks.
- Set Target Thresholds: Aim for a technical debt ratio below 5% for a healthy, maintainable codebase. A ratio exceeding 10–15% often indicates that maintenance costs are becoming a significant drag on productivity.
- Automate Debt Analysis: Use tools like SonarQube, CodeClimate, or Klocwork to automatically scan your code and quantify debt. Integrate these scans into your CI/CD pipeline to get immediate feedback on new code.
- Allocate Time for Reduction: Dedicate a consistent portion of your development capacity, typically 15–20% of each sprint, to addressing technical debt. This prevents debt from accumulating to unmanageable levels.
- Focus on Trends, Not Absolutes: The absolute debt value can be intimidating. Instead, focus on tracking the trend over time. A decreasing ratio shows progress, while a rising ratio is an early warning sign that requires immediate attention.
8. Customer Satisfaction Score (CSAT)
The Customer Satisfaction Score (CSAT) is a direct, user-focused metric that measures how satisfied customers are with your software, a specific feature, or a recent interaction. It is a vital KPI for software development because it bridges the gap between technical output and real-world user value, providing immediate insight into whether the product truly meets user needs and expectations. Unlike internal metrics, CSAT offers an unfiltered view directly from the end-user.
How Customer Satisfaction Score (CSAT) Works
CSAT is typically measured by asking a simple question like, "How satisfied were you with this feature?" Users respond on a predefined scale, often 1-5 or 1-10. The score is calculated as the percentage of "satisfied" responses (e.g., scores of 4 and 5 on a 5-point scale) out of the total number of responses. This metric provides a clear, quantitative signal of user sentiment that teams can track over time.
Leading tech companies use this KPI to guide their development priorities. For instance, Slack consistently maintains over 98% customer satisfaction by integrating user feedback directly into its development cycles. Similarly, Zoom reportedly improved its CSAT from 85% to 95% by systematically identifying and resolving top user-reported pain points, demonstrating how this metric can drive meaningful product improvements.
Actionable Tips for Implementation
To make CSAT an effective KPI, you must collect and act on the data strategically.
- Collect Feedback at Multiple Touchpoints: Don't just ask for feedback once. Implement surveys after a new feature is used, a support ticket is closed, or a user completes a key workflow to gather context-specific insights.
- Segment Your CSAT Data: Analyze satisfaction scores by user demographics, subscription tier, or specific features. This segmentation helps you identify which user groups are happiest and which features may be causing friction.
- Combine CSAT with Usage Analytics: A user might report high satisfaction but have low engagement. Combining CSAT with usage data provides a more complete picture, helping you understand if satisfied users are also active, loyal customers.
- Actively Follow Up on Feedback: Establish a process to follow up on negative or neutral feedback. This not only helps you resolve specific issues but also shows users that their opinions are valued, which can turn a negative experience into a positive one.
Key KPI Comparison for Software Development
| Metric | Implementation Complexity 🔄 | Resource Requirements ⚡ | Expected Outcomes 📊 | Ideal Use Cases 💡 | Key Advantages ⭐ |
|---|---|---|---|---|---|
| Code Coverage | Moderate - requires test instrumentation | Medium - test infrastructure and tools needed | Improved test thoroughness and code quality insights | Automated testing improvement and quality control | Identifies untested code; quantifiable coverage |
| Deployment Frequency | Moderate to High - CI/CD pipelines needed | High - automation, monitoring, and testing tools | Faster delivery and improved deployment cadence | DevOps teams aiming for rapid, frequent releases | Enables quick feedback; reduces deployment risk |
| Lead Time | Moderate - end-to-end tracking systems | Medium to High - process and tooling integration | Visibility into delivery duration; identifies bottlenecks | Teams optimizing software delivery process | Provides full delivery speed picture; aids process improvements |
| Defect Density | Low to Moderate - mainly measurement | Low - defect tracking integrated with codebase | Objective quality measurement | Quality assurance and release readiness evaluation | Normalizes defects by code size; benchmarks quality |
| Mean Time to Recovery | Moderate - incident tracking systems | Medium - monitoring and automation tools | Faster incident resolution and improved system resilience | Operations and SRE teams managing uptime | Correlates with user satisfaction; operational excellence |
| Sprint Burndown | Low - simple charting tools needed | Low - project management software or add-ons | Real-time visibility of sprint progress | Agile teams tracking sprint work | Early risk detection; improves team communication |
| Technical Debt Ratio | Moderate - requires analysis and estimation | Medium - static analysis and debt measurement tools | Prioritized refactoring decisions; maintainability insight | Long-term code quality and maintainability planning | Makes debt visible; helps avoid excessive accumulation |
| Customer Satisfaction Score (CSAT) | Low - survey implementation easy | Low to Medium - feedback collection systems | Direct insight into user satisfaction | User experience monitoring and feature prioritization | Provides user perspective; easy to communicate |
From Data to Decisions: Turning KPIs into a Competitive Advantage
Navigating the complex landscape of software development without the right data is like sailing in uncharted waters without a compass. The eight key performance indicators we’ve explored, from Code Coverage and Deployment Frequency to Technical Debt Ratio and Customer Satisfaction (CSAT), are not just numbers on a dashboard. They are the essential instruments that provide clarity, direction, and a deep understanding of your team's health, efficiency, and the quality of the product you deliver.
Each KPI for software development tells a unique part of your operational story. While Lead Time reveals the speed of your value delivery stream, Mean Time to Recovery (MTTR) highlights your team's resilience in the face of failure. Similarly, tracking Sprint Burndown charts provides a micro-level view of your team's progress and predictability, while monitoring Defect Density offers a crucial macro-level perspective on long-term code quality. The true power emerges not from tracking a single metric in isolation, but from understanding their interconnectedness. A high Deployment Frequency, for instance, is only truly valuable if it's paired with a low MTTR and stable Defect Density.
Making KPIs Actionable: Your Next Steps
Moving from theory to practice is the most critical step. Instead of attempting to implement all these metrics at once, which can lead to data overload and analysis paralysis, adopt a more strategic and incremental approach.
- Start Small and Focused: Choose two or three KPIs that directly address your team's most pressing challenges. If your releases are plagued by bugs, begin with Defect Density and MTTR. If stakeholders are concerned about delivery speed, focus on Lead Time and Deployment Frequency.
- Establish a Baseline: Before you can improve, you must know where you stand. Dedicate a sprint or a specific time frame to gathering initial data for your chosen KPIs. This baseline is your foundational benchmark against which all future progress will be measured.
- Foster a Culture of Improvement, Not Blame: KPIs should be a tool for collective learning and growth, not individual performance evaluation. Frame discussions around the data as team-oriented problem-solving sessions. The goal is to identify systemic bottlenecks and process inefficiencies, not to assign fault.
- Integrate and Automate: Manually tracking metrics is tedious and prone to error. Leverage your existing toolchain, like Jira, GitHub Actions, or specialized monitoring platforms, to automate data collection and reporting. This ensures accuracy and frees up your team to focus on analysis and action rather than manual data entry.
Ultimately, mastering the use of KPIs for software development is about transforming raw data into strategic decisions. It’s about creating a feedback loop that empowers your team to build better software, create a more sustainable and rewarding work environment, and consistently deliver exceptional value to your users. By embracing this data-driven mindset, you're not just managing a project; you're building a high-performing engineering culture poised for long-term success and innovation.
Ready to transform your product idea into a market-ready reality with a team that lives and breathes these principles of efficiency and quality? Iglu Digital specializes in a fixed-price MVP development program, leveraging a data-informed approach to build and launch your product faster. Explore how we can accelerate your journey from concept to code.