

A Guide to Story Points Estimation

Table of Contents
Story points are a bit of an art and a science in the agile world. They're a way for teams to measure the effort required to finish a piece of work, but without getting bogged down in hours and minutes. Think of it as a relative unit of measurement. Instead of guessing how long a task will take, the team assigns points based on how complex it is, the risks involved, and the sheer volume of work. This makes story points estimation a fantastic tool for getting everyone on the same page during planning.
What Are Story Points and Why Do They Matter?

Here’s a simple analogy. Imagine you’re planning a road trip. You could try to estimate the exact time it'll take to drive each leg of the journey, but you'd quickly get stuck arguing about potential traffic, weather delays, and unscheduled bathroom breaks. It’s a fool's errand. A much better approach? Just agree on the total distance and a rough idea of the route. That's exactly how story points work for software development.
Instead of getting hung up on time-based guesses like, "this feature will take exactly 16 hours," agile teams use points to talk about the relative size of a user story. A task that’s a 5 is roughly half the effort of a task that’s a 10. This subtle shift changes the entire conversation. It moves the focus from hitting a specific, often arbitrary, deadline to creating a shared understanding of what needs to be done.
The Three Pillars of a Story Point
So where do these points come from? They aren't just random numbers. A story point value is a blend of three crucial factors that give a holistic view of the task at hand:
- Complexity: How hard is this to actually do? Are we talking about a simple UI tweak, or does it involve new algorithms, tricky logic, or a technology nobody on the team has touched before?
- Risk and Uncertainty: What could go wrong? This is where we account for the unknowns. Are there dependencies on another team? Is the path forward crystal clear, or will we need to do some research and experimentation to figure it out?
- Effort: This is about the sheer volume of work. It’s not just about coding. It’s everything required to get the story to "done"—coding, writing tests, documentation, manual testing, you name it.
Considering all three gives the team a much richer picture of each task. This approach is central to grasping why some work is simple and some is complex, which is a key concept in the world of agile. For a deeper dive into these concepts, check out our guide on essential agile software development terminology.
Story Points vs Time-Based Estimates at a Glance
To make the distinction clearer, let's break down the core differences between these two approaches. While time-based estimates have their place, story points are often a better fit for the dynamic nature of agile development.
| Attribute | Story Points Estimation | Time-Based Estimation |
|---|---|---|
| Unit of Measure | Abstract points representing relative effort | Concrete units like hours or days |
| Focus | How big is the work? | How long will it take? |
| Perspective | Team-based and collaborative | Individual-based and often siloed |
| Impact of Skill Level | Consistent across team members | Varies significantly by individual |
| Adaptability | Remains stable over time (velocity adjusts) | Estimates must be constantly re-evaluated |
| Goal | To understand relative size and forecast work | To predict a specific delivery date |
Ultimately, story points help teams think collectively about the work, leading to more realistic and sustainable planning over the long haul.
The Fibonacci Sequence in Estimation
If you've been around agile teams, you've probably seen this sequence used for story points: 1, 2, 3, 5, 8, 13, 20. There's a good reason for this specific numbering.
The widening gaps between the numbers are intentional. They naturally reflect the increasing uncertainty that comes with bigger, more complex tasks. It's pretty easy to tell the difference between a 1-point story and a 2-point story. But telling the difference between a 20 and a 21? It’s practically impossible and a waste of time to debate.
This scale forces the team to make meaningful distinctions and avoids the trap of false precision. It's a practical application of a psychological principle called Weber's Law, which states that humans are better at perceiving relative differences than absolute ones. This simple but powerful technique is all about fostering better conversations and helping the team find a rhythm they can maintain sprint after sprint.
Why Bother With Story Points? The Real-World Payoffs
When a team truly gets the hang of story points, estimation stops being a chore and starts becoming a strategic advantage. It’s a subtle but powerful shift. Instead of getting bogged down in debating hours, teams start reaping benefits that genuinely change how they plan, work together, and get things done.
This approach lets teams build a predictable, sustainable rhythm. By focusing on effort instead of time, they establish a reliable team velocity—that's just the average number of points they knock out in a typical sprint. This number becomes a powerful gauge of their true capacity, making long-term forecasting far more accurate without the stress of chasing arbitrary deadlines.
It Gets Everyone on the Same Page
One of the best, and often most surprising, benefits of estimating with story points is the conversation it forces. You can't just slap a number on a user story and move on. To agree on a point value, your whole team—developers, designers, testers, everyone—has to talk through the work from every possible angle.
It’s in these discussions that the magic happens. You’ll uncover hidden complexities, flag potential risks, and spot dependencies you would have otherwise stumbled over mid-sprint. It ensures everyone shares the same vision of what "done" actually means for that specific task.
This isn't just about getting a better number; it's about building a better product. When you bring all those different perspectives into the estimation process, the team naturally starts thinking ahead, anticipating problems, and designing stronger solutions right from the get-go.
It’s About the Work, Not the Person
Here’s a crucial advantage: story points separate the work from the individual. A 5-point story is a 5-point story, whether a senior developer with ten years of experience picks it up or a junior dev fresh out of college does. This solves one of the biggest headaches of time-based estimates.
Think about it like this: imagine a marathon runner and a casual jogger are standing at the start of a trail. They would argue all day about how long it will take to finish, but they can both look at the map and agree the trail is 5 miles long. Story points are the "miles" in this analogy—a fixed measure of size and effort.
This separation has a few fantastic side effects for the team:
- It lowers the pressure. No one feels like they're being punished for being less experienced or like they have to be the "fastest" to be valued. The focus stays squarely on the complexity of the task itself.
- It encourages collaboration. It makes it easier for senior members to pair with junior developers on tricky stories without anyone worrying about messing up the timeline.
- It leads to better forecasting. Because velocity is a team-level metric, it smooths out all the individual differences in speed. This makes your long-term planning much more dependable.
Ultimately, this approach helps everyone, especially stakeholders, understand the true cost to develop software based on what the team can produce, not on how many hours people are logging. By focusing on collective output, teams deliver more consistently, which builds trust and leads to much better project outcomes.
Proven Techniques for Story Points Estimation
Alright, so your team gets why story points are a game-changer. Now for the fun part: mastering the how. There are a few battle-tested ways to run a great story points estimation session, and each has its place, whether you're deep in the weeds of sprint planning or just getting a high-level feel for the backlog.
The heart of any estimation session is pretty simple: you grab a user story, talk it through, and collectively decide on a point value. It’s a structured conversation that’s all about building a shared understanding of the work.
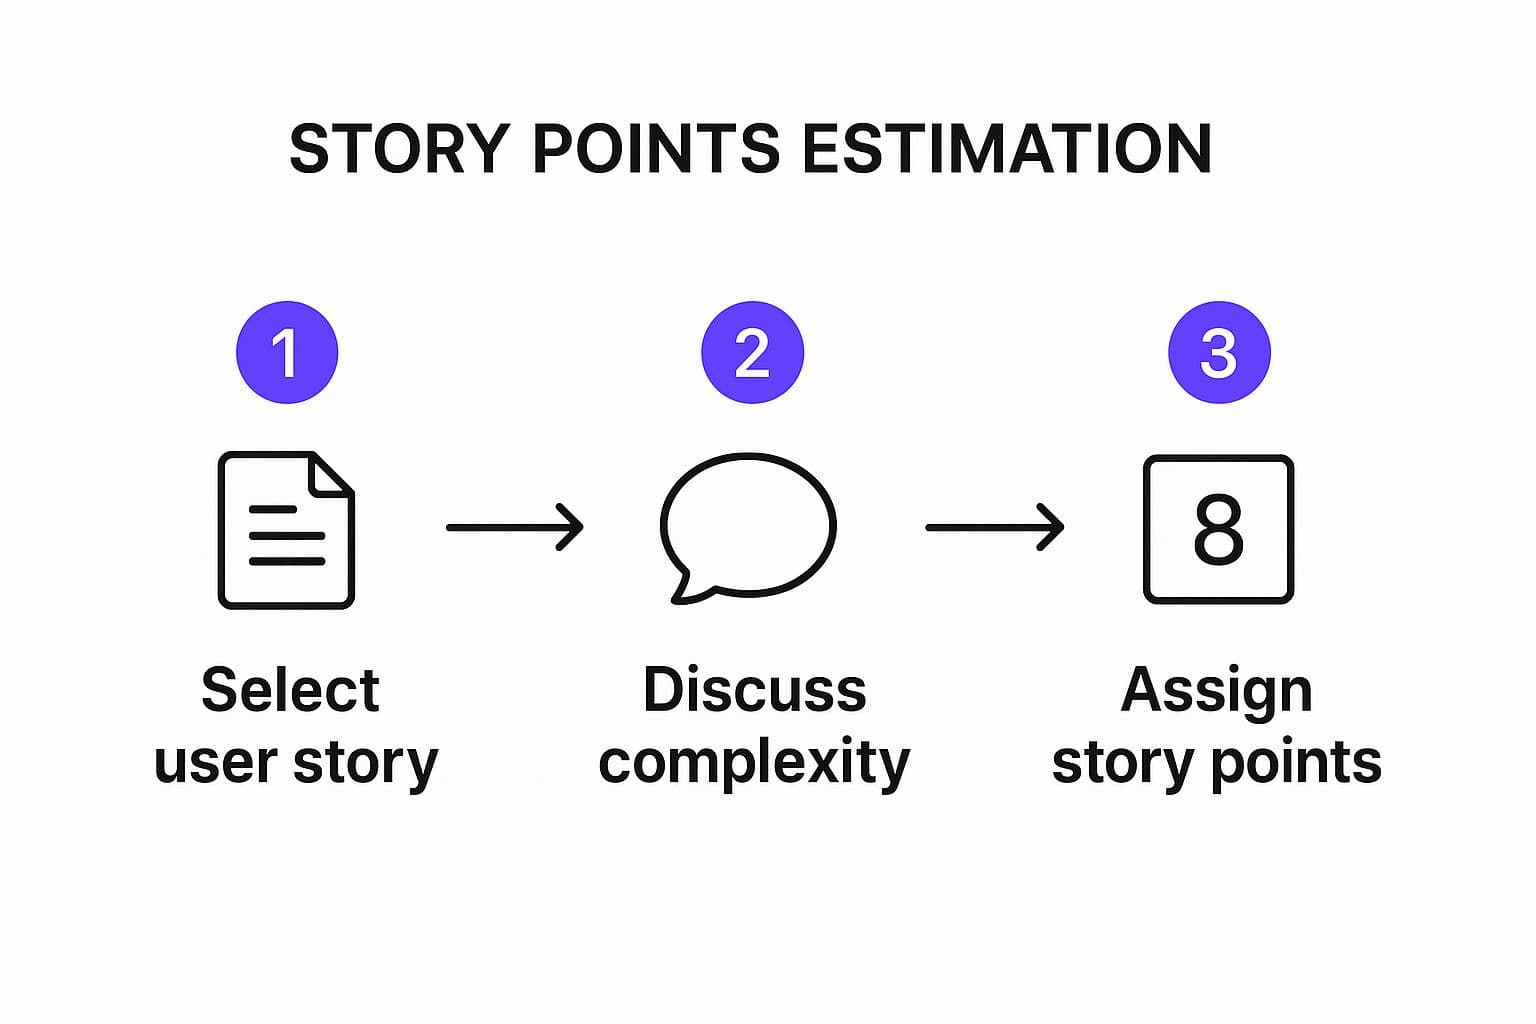
This simple flow drives home a key point: estimation isn't just about slapping a number on a ticket. It's about the dialogue that gets you there, uncovering assumptions and getting everyone on the same page before a single point is assigned.
Planning Poker
Let's start with the crowd favorite: Planning Poker. This is probably the most common technique you'll see, and for good reason. It’s a consensus-driven approach that cleverly sidesteps some classic groupthink pitfalls, like the "anchoring effect"—where the first number someone throws out heavily influences everyone else.
A typical Planning Poker session is straightforward:
- Story Time: The product owner or manager walks the team through a user story, explaining the goal and what "done" looks like. The team then pokes and prods with questions until the scope feels clear to everyone.
- Private Vote: Every team member—devs, QA, designers, you name it—privately picks a card from their deck that represents their estimate. These cards usually follow a modified Fibonacci sequence (1, 2, 3, 5, 8, 13...).
- The Reveal: On the count of three, everyone shows their card at the same time. This is the magic step that prevents one person's opinion from swaying the group.
- Talk It Out: If the numbers are all close, fantastic—you can settle on a value and move on. But what if you see a 3 and an 8? This is where the real value emerges. The folks with the lowest and highest estimates explain their thinking. More often than not, this conversation uncovers a hidden complexity or a misunderstanding. The team discusses, then votes again until they land on a number everyone can stand behind.
This structured dialogue is what makes the process so powerful. Teams that get into a good rhythm with Planning Poker often find their sprint planning meetings get a whole lot faster—sometimes cutting planning time by 30%-50%—while also making their estimates more reliable. For a deeper dive, there's a great article on how story points and team collaboration work hand-in-hand.
T-Shirt Sizing
Need to get a quick read on a mountain of features without getting lost in the details? T-shirt Sizing is your best friend. Instead of arguing over a 3 versus a 5, you simply group items into rough buckets: Extra Small (XS), Small (S), Medium (M), Large (L), and Extra Large (XL).
This technique is perfect for early-stage backlog grooming. You have a ton of ideas, and you just need a quick, relative sense of effort. A simple copy change on the homepage? That's an XS. Building out a brand-new payment integration from scratch? Definitely an XL.
Later on, when you're ready for sprint planning, you can easily map these sizes to your story point scale (e.g., S = 2, M = 5, etc.). It’s a fantastic way to triage a large backlog without the upfront-effort of a full estimation session.
Affinity Mapping
Okay, what if you're staring down a backlog with hundreds of stories? Estimating them one by one with Planning Poker would take forever. This is where Affinity Mapping (or Affinity Estimation) comes in to save the day. It’s a highly visual, collaborative, and surprisingly fast way to estimate in bulk.
Here’s the rundown:
- Prep the Board: Get every user story onto its own sticky note or index card.
- Sort in Silence: Team members grab the stickies and start placing them on a large wall or whiteboard. There are no words, just movement. The rule is simple: smaller, easier stories go to the left, and larger, more complex ones go to the right. Anyone can move any card at any time.
- Discuss the Layout: After a few minutes, the movement will slow down as a natural order emerges. Now it’s time to talk. The team discusses the placement, challenging anything that looks out of place and making adjustments.
- Group and Point: Finally, you draw vertical lines to create columns of similarly-sized stories. Then, you just assign a story point value to each column—the far-left column might be 1 point, the next one 2 points, and so on, following your scale.
Affinity mapping is incredibly efficient because it taps into the team's collective gut feeling to build a relative scale almost instantly. It turns what could be a long, tedious meeting into a dynamic, engaging activity that can size an entire backlog in a surprisingly short amount of time.
Getting Started with Story Points Estimation

Making the jump to story points can feel a little abstract at first, but diving in is a lot easier than you’d expect. The whole system is built on creating a shared understanding, a common language for effort. Your first job is to establish a baseline—the anchor that every other estimate will be compared against.
This isn't about finding some mythical "perfect" story. It's about finding a "known" story. The idea is to grab a small, simple piece of work from your backlog that the entire team gets. It should be low on the complexity scale and have almost zero question marks around it.
Establish Your Baseline Story
Think of this first story as your team's yardstick. Just as a ruler gives you a standard unit of measure for length, this baseline story gives you a standard unit of measure for effort.
To pick your baseline, the team should look for a user story that:
- Is small and dead simple to build.
- Is crystal clear to everyone—developers, QA, designers, the works.
- Has very few unknowns or dependencies on other teams or systems.
Once you’ve found a good candidate, the team agrees to give it a low value from your scale, usually a 2. Why not a 1? Starting with a 2 leaves you some breathing room. Later on, you'll inevitably find tasks that are genuinely half the effort, and you'll have a number for them.
This 2-point story is now your gold standard. Every estimation conversation from here on out will start with the question, "So, how does this new story stack up against our baseline 2?" Is it about the same? Is it roughly double the work? Maybe it's way bigger? This simple comparison is the heart and soul of story points estimation.
Conduct Your First Estimation Session
With your yardstick in hand, you're ready to run your first estimation session. This is a team sport, not a lecture. If you're facilitating, your job is to guide the conversation and make sure everyone gets a say.
Here’s a basic game plan for that first meeting:
- Get the Right People in the Room: The whole cross-functional team needs to be there. You need the perspectives of everyone who will touch the work to spot hidden complexities.
- Tackle One Story at a Time: The product owner walks through the user story, explaining what needs to be done and why it matters. This is the team’s chance to ask questions until everyone is on the same page.
- Let the Discussion Flow: This is where the magic happens. Team members talk through the technical approach, call out potential roadblocks, and flag any risks. The goal is to build a shared picture of what the work actually entails.
- Estimate and Align: Using a technique like Planning Poker, everyone sizes the story relative to the baseline. If votes are all over the place, talk about the differences until you land on a number the team can agree on.
Your first estimates will probably feel a little clumsy, and that's completely okay. Don't get bogged down in a 20-minute debate over whether a story is a 3 or a 5. Just make a call, note any assumptions, and keep the momentum going. Your sprint retrospectives are the perfect place to look back and adjust.
Building this consistent process is just as crucial as any other part of a project; it’s like how a well-defined software implementation plan gets everyone on the same page for a smooth launch.
The most important thing is to trust the process. Lean into the collaborative nature of estimation, keep the focus on relative sizing, and give your team the time it needs to build its estimation muscle.
Common Mistakes to Avoid with Story Points
Story points can make a world of difference in your team's planning and collaboration, but it's easy to fall into a few common traps that can derail the whole process. Getting the technique right is only half the battle; knowing what not to do is just as important. If you can steer clear of these mistakes, you’ll keep your estimation process healthy, effective, and trusted by everyone on the team.
The single biggest, most damaging error is trying to map story points directly to a fixed number of hours. You've probably heard it before: "Let's just say one point equals eight hours." This one simple mistake completely defeats the purpose of using a relative scale. Story points are meant to be an abstract measure of effort, complexity, and uncertainty—a value that stays consistent no matter who picks up the work.
When you tie points to hours, you drag all the old problems you were trying to escape right back into the process. A senior developer might knock out a task in four hours, but a junior developer could need twelve. Forcing them both to use an "hours-per-point" formula means they'll come up with different point estimates for the exact same task. Just like that, your team’s shared understanding is gone.
Equating Points with Time
This mistake usually comes from a good place—a desire for familiar, concrete numbers. But it creates far more problems than it solves. As soon as a team is told that one point equals a specific block of time, they stop thinking relatively. Every estimation meeting turns into a mental math exercise where they guess the hours first, then divide by the magic number to get the points.
This pushes everyone back into their own silos, wiping out the collaborative magic. The conversation shifts from, "How complex is this really?" to, "How long will this take me?" which is the very trap story points are designed to help you avoid.
Changing Points Mid-Sprint
Another classic misstep is changing a story's point value after the sprint has already kicked off. The team might discover that a 3-point story is actually a monster in disguise and feel the urge to bump it up to an 8. It feels like the right thing to do, but this can seriously mess with your team's velocity and make any long-term forecasting a shot in the dark.
Think of the original estimate as a snapshot of the team's understanding at that moment in planning. Sticking with it, even when you realize it was off, gives you incredibly valuable data. A story that consistently takes more effort than estimated isn't a failure—it's a learning opportunity and a perfect topic for the sprint retrospective.
Other Common Pitfalls to Sidestep
Beyond those two big ones, a few other habits can slowly poison your estimation process. Keeping an eye out for these will help your team get the most out of using story points.
Even the most well-intentioned teams can stumble. It's not about being perfect from day one, but about recognizing these common issues and having a plan to address them.
Here's a quick rundown of some frequent mistakes and how you can get back on track.
Common Pitfalls and Their Solutions
| Common Mistake | Why It's a Problem | How to Fix It |
|---|---|---|
| Management Pressuring the Team | When leaders push for lower estimates or question the team's judgment, trust evaporates. The team may start giving the "right" answers instead of honest ones, leading to burnout and failed sprints. | Management should trust the team as the experts. Their role is to ask clarifying questions about scope, not to dictate the estimate. Create a safe environment where the team can be honest without fear of reprisal. |
| Comparing Velocity Across Teams | Each team's point scale is unique. Comparing Team A's velocity of 25 to Team B's 40 is like comparing apples and oranges. It creates unhealthy competition and incentivizes teams to inflate estimates. | Treat velocity as an internal metric for a single team's planning. Never use it as a performance KPI or for cross-team comparisons. Educate leadership on the purpose of velocity. |
| Estimating in Silos | When only developers estimate without input from QA, design, or other roles, they're guaranteed to miss things. This results in wildly inaccurate estimates and surprise work later on. | Make estimation a whole-team activity. Everyone who will touch the work—from design to deployment—must be in the room and have a voice during Planning Poker or other estimation sessions. |
Ultimately, getting better at this comes down to tracking your history and learning from it. Since teams started adopting story points, we've seen a ton of data on what works. High-performing teams often complete around 20-30 story points in a typical two-week sprint. More importantly, teams that consistently analyze their performance data can improve their release predictability by up to 25%.
You can find more real-world insights about how teams are using story point metrics at middlewarehq.com. By dodging these common mistakes and focusing on getting a little better with each sprint, your team can turn story point estimation into a truly powerful tool for building great products.
Frequently Asked Questions About Story Points
Even the sharpest teams run into tricky situations when they first start using story points. The basics are one thing, but what happens when reality doesn't fit neatly into the box? This section is all about tackling those common "what if" scenarios.
Think of this as your field guide. Getting everyone on the same page about these edge cases is what makes story points a reliable tool instead of a source of confusion.
Should We Re-Estimate Unfinished Stories?
That’s an easy one: no. It's almost always a bad idea.
When your team first estimates a story, that number is a valuable snapshot of your understanding at that moment. It captures what you thought the effort would be. Changing that number later on completely messes with your velocity data. Velocity is your key forecasting tool, and its power comes from consistency.
If you start re-estimating unfinished work, you introduce a ton of noise into your metrics, making it impossible to predict what you can accomplish in future sprints.
So, what’s the right move? Just move the unfinished story back into the backlog with its original points. Your velocity should only ever count points for stories that are 100% complete and meet your team's "Definition of Done." This keep-it-clean approach makes your long-term data trustworthy and helps you spot recurring problems—like why that big, complex story keeps getting punted sprint after sprint.
How Do You Estimate Bugs and Spikes?
This is a classic debate, and the most important answer is simply to be consistent. Pick a lane and stay in it.
Here’s how most experienced teams handle it:
- Bugs Found Mid-Sprint: These are interruptions, plain and simple. Many teams don't point them at all. The effort to fix them is just absorbed into the sprint, which will naturally (and correctly) lower that sprint's final velocity.
- Bugs from the Backlog: If a bug is a known issue you're planning to tackle, treat it like any other story. It goes in the backlog and gets estimated based on the complexity of finding the root cause and implementing a fix.
- Spikes (Research Tasks): A spike is all about reducing uncertainty, not delivering direct user value. Because of that, teams tend to handle them in one of two ways. Some simply time-box them (e.g., "spend no more than 4 hours on this") and assign zero points. Others assign points based on the complexity and effort of the research itself.
Ultimately, it doesn’t matter which method you choose. What matters is that your team agrees on an approach and applies it every single time. That’s how you keep your velocity a reliable measure of what you can actually get done.
What Is Team Velocity and How Is It Calculated?
In a nutshell, team velocity is the average number of story points your team truly finishes in a sprint. It’s the metric that tells you your sustainable pace.
Calculating it is straightforward. At the end of a sprint, add up the points for all the stories that are completely finished and meet your "Definition of Done." Nothing partially done counts. Ever.
For example, if you finished stories worth 3, 5, 8, and 5 points, your velocity for that sprint is 21. But you never want to rely on a single sprint. To get a reliable number for forecasting, you should always look at the average velocity over the last three or four sprints. This smooths out the inevitable bumps and gives you a much more honest number for planning.
Can We Compare the Velocity of Different Teams?
Let me be crystal clear: Absolutely not. Never, ever, ever compare the velocity of two different teams.
Doing this is one of the most common and destructive mistakes a manager can make. Story points are a relative measure, and the scale is completely unique to the team that created it. A "5-point" story for Team A means something totally different than a "5-point" story for Team B. They have different skills, different reference stories, and a different internal gut-feel for their own scale.
When you start comparing velocity, you turn a useful planning tool into a weapon. Teams will feel pressured to start inflating their estimates just to "look good," which makes the numbers meaningless. You destroy the trust and make forecasting impossible.
Ready to turn your great idea into a tangible product without getting lost in endless planning cycles? At Iglu Digital, we specialize in building market-ready MVPs with the scope and the price agreed before we start, helping you validate your concept with real users fast. Discover how our streamlined process can bring your vision to life.